Science Features
 Loading Page...

Portion of 1898 Philadelphia, PA-NJ 1:62,500-scale topographic map
Historical maps can be the last piece of the puzzle in genealogy research. What did the landscape look like decades ago when your ancestors settled in your town? How have place names, roads, and streams changed over time?
Although technically out of date, these historical maps are often helpful to those researching a specific geographic location, such as genealogists, scientists, and environmentalists.
For almost 130 years the USGS topographic mapping program has accurately depicted the complex geography of our Nation. Physical and cultural features change over time. Maps are updated and new editions are printed. For decades most of these rare old maps were long since forgotten and out of circulation.
No single complete set of the almost 180,000 USGS topographic maps even existed. Only those researchers with access to the USGS Topographic Map Archive located in Reston, Va., had an opportunity to take a glimpse at these time capsules of cartographic information.
Beginning three years ago, this all changed. Anyone can now sit at home and view and download USGS historical maps.
The Historical Topographic Map Collection
The goal of the Historical Topographic Map Collection was to create an electronic collection of all printed quadrangles – all maps, all scales – beginning with the earliest editions prior to US Topo, a new generation of topographic maps. Other important objectives included:
The National Program for Topographic Mapping began soon after the USGS was established in 1879. On December 4-5, 1884, John Wesley Powell addressed the U.S. Congress seeking authorization for the U.S. Geological Survey to begin methodical topographic mapping of the United States. Mapping techniques evolved from field surveys through photogrammetry, the process of making maps using aerial photographs, to the computer-based methods currently used. The scales and content of the topographic maps changed as well as the need for more detailed mapping came about. Much of the colorful history of topographic mapping is portrayed in USGS Circular 1341, History of the Topographic Branch (Division).

Oldest USGS Pennsylvania map: 1888 Quakertown, PA 1:62,500-scale topographic map
Map Changes Over Time
Map scales have varied over time. Smaller scale maps, showing more area and less detail, were produced first, in the 1800s. These maps included the 1:125,000-scale, a 30-minute map covering 30-minutes of latitude and longitude with one inch equaling two miles in distance on the map. In the early 20th century the 15-minute, or 1:62,500-scale maps were introduced and users were presented with even more detail. The current 7.5-minute, or 1:24,000-scale maps, cover as much as 70 square miles where one inch equals 2000 feet.
Map symbology has also changed over time. As the need for new symbols arose, some were abandoned, while others were added. For example, the electronic trolley car symbol, used frequently during the early part of the 20th century, is non-existent on later maps.
So far over 155,000 maps have been scanned with only a handful of states remaining. The status graphic, a visual representation of what maps have been uploaded, is updated frequently. Additional historical documents supporting early topographic mapping will be added to the collection down the road.
How to Obtain Historical Maps
Historical topographic maps, as well as current editions may be viewed and downloaded for general reference on the USGS Store in the GeoPDF® electronic format accessible using all browsers. Starting later this year, the historical maps can be combined with current mapping data from The National Map as a GeoTIFF image product. Complete metadata is available for all maps.
Copies of the historical maps may be purchased as a $15 paper product via the USGS Store, or by calling (888) ASK-USGS, and selecting option 1. They may also be downloaded onto a portable device, such as a flash drive, to have printed at your local copy shop. USGS maps are within the public domain, so there are no copyright restrictions.
The armchair genealogist now has that usefull tool, historical maps, to help illustrate fascinating family histories.

Manatees are often used as sentinels for emerging threats to the ocean environment and human health. Read more

The USGS plans to "app-lify" data with a contest through Challenge.gov. Prizes will be awarded to the best overall app, the best student app, and the people’s choice. Read more

Washington, D.C., is a unique city full of landmarks and buildings that are recognizable worldwide. But how were these stone giants built? Read more

Hurricane Sandy is a stark reminder of just how essential it is for the Nation to become more resilient to coastal hazards.Read more

Please comment on the USGS’ draft science strategies! Read more

Meet Marnelli Taasin, a student trainee working in Administrative Management with the USGS in Hawaii. Read more

Timing is everything! Consider helping track changes in spring’s arrival

Flood Safety Awareness Week is March. 12-16. What can you do to prepare?
National Groundwater Awareness Week is Mar. 11-17, 2012. See how USGS science is connecting groundwater and surface water.

Since Japan’s March 11, 2011, Tohoku earthquake and subsequent tsunami, scientists at the USGS have learned much to help better prepare for a large earthquake in the United States.

Five USGS employees honored with Distinguished Service Awards for their service to the nation

The USGS and UNESCO have produced a book that gives us a new way to look at our shared global heritage.

It’s National Invasive Species Awareness Week. Did you know invasive species cost our country more than 100 billion dollars each year? Get to know America’s ten top invaders this week.

The proposed USGS budget reflects research priorities to respond to nationally relevant issues, including water quantity and quality, ecosystem restoration, hydraulic fracturing, natural disasters such as floods and earthquakes, and support for the National Ocean Policy, and has a large R&D component.

A student geographer shares her experiences and career path with the USGS. Most memorable moment

Everyone is familiar with weather systems on earth like rain, wind and snow. But space weather – variable conditions in the space surrounding Earth – has important consequences for our lives inside Earth’s atmosphere.
USGS crews continue to measure streamflow and collect water quality and sediment samples in the Ohio and Mississippi River basins using state-of-art instruments.
Science earns prominent focus in the new Department of the Interior Five-Year Strategic Plan.
http://www.facebook.com/USGeologicalSurvey

The extent and distribution of the world’s ice, primarily in the form of glaciers, provide insight about changes in the Earth’s climate and changes in sea-level. Read more

The Nation’s next Earth-observing satellite was successfully launched on February 11. Once it is mission-certified in orbit, the satellite will become Landsat 8. Read more

The recent past sheds light on preserving the future of economically and ecologically important native trout populations across the West. Read more
Washington, D.C., is a unique city full of landmarks and buildings that are recognizable worldwide. But how were these stone giants built? Read more

Watch USGS scientists in the Arctic track Pacific walruses to examine how these animals are faring in a world with less sea ice. Read more

The world's longest-running Earth-observing satellite program.

Dust storms July 21-22 blinded motorists, grounded flights and knocked out electricity. What’s causing the dust storms?

The majority of the nation is facing dry conditions; in most areas drought conditions are expected to persist or intensify. Read more
A contest to celebrate 40 years of Landsat. Read more
Please comment on the USGS’ draft science strategies! Read more
Timing is everything! Consider helping track changes in spring’s arrival
Flood Safety Awareness Week is March. 12-16. What can you do to prepare?
National Groundwater Awareness Week is Mar. 11-17, 2012. See how USGS science is connecting groundwater and surface water.
Since Japan’s March 11, 2011, Tohoku earthquake and subsequent tsunami, scientists at the USGS have learned much to help better prepare for a large earthquake in the United States.
Five USGS employees honored with Distinguished Service Awards for their service to the nation
The USGS and UNESCO have produced a book that gives us a new way to look at our shared global heritage.

Groundwater in aquifers on the East Coast and in the Central U.S. has the highest risk of contamination from radium, a naturally occurring radioactive element and known carcinogen.
The proposed USGS budget reflects research priorities to respond to nationally relevant issues, including water quantity and quality, ecosystem restoration, hydraulic fracturing, natural disasters such as floods and earthquakes, and support for the National Ocean Policy, and has a large R&D component.
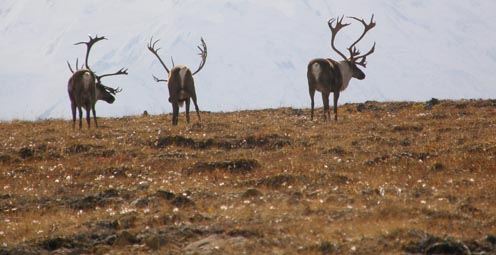
Caribou expert Layne Adams discusses the lives of reindeer — apart from their famous role on Christmas Eve. How they survive the cold.

Climate science is helping to predict food shortages, identify impacts on human health, and prepare for future conditions.

As demand grows, Landsat data can help us track trends in key resources. Remote-sensing satellites help scientists to observe our world, monitor changes, and detect critical trends in forestry, water, crops, and urban landscapes. Learn more.

A new study provides crucial information for difficult decisions regarding conservation, economic interests, and food and water security. Projected changes for 2010-2099

It's only the beginning of their careers, but these 3 young scientists have forged ahead with innovative research at the frontiers of science. How they've transformed their fields

Oct. 9-15, 2011, is Earth Science Week, themed "Our-Ever Changing Earth," and Oct. 12, 2011, is International Day for Natural Disaster Reduction. Answers to questions posed by a changing world

By 1936, devastating losses of wildlife populations were threatening the Nation’s natural resource heritage. America's first wildlife research center

A dust storm on Tuesday, October 4, blinded motorists and caused a large string of motor vehicle crashes, multiple injuries, and at least one death. What’s causing the dust storms?
USGS scientists study walruses off the northwestern Alaska coast in August as part of their ongoing study of how the Pacific walrus are responding to reduced sea ice conditions in late summer and fall.
USGS scientists are collecting water samples and other data to determine trends in ocean acidification from the least explored ocean in the world.
In support of the Famine Early Warning Systems Network, USGS scientists use satellite remote sensing to assess agricultural conditions that foretell famine.
New USGS research shows that rice could become adapted to climate change and some catastrophic events by colonizing its seeds or plants with the spores of tiny naturally occurring fungi. The DNA of the rice plant itself is not changed; instead, researchers are re-creating what normally happens in nature.
Now that field work has wrapped up at the Ice Age "Snowmastodon" fossil site near Snowmass Village, Colo., USGS and other scientists will begin work on unraveling the climate and environmental history of the area.
USGS scientists are studying the Earth’s conditions 3 million years ago to gain insight into the impacts of future climate. Join us Aug. 3 in Reston, Va., to learn how this information is used to better understand the magnitude of changes forecast for the end of this century.
USGS crews continue to measure streamflow and collect water quality and sediment samples in the Ohio and Mississippi River basins using state-of-art instruments.
Over the past four decades, about 14% of the ice and permanent snow of Washington's Mount Rainier has melted due to combined recent warming and reduced precipitation.
USGS science supports management, conservation, and restoration of imperiled, at-risk, and endangered species.
In a unique application of data, this year's report provides the nation's first assessment of birds on public lands and waters.
The USGS, NASA, and other organizations and Federal agencies are studying how climate change affects wildlife and ecosystems.

Using coral growth records and measurements of changing ocean chemistry from increased atmospheric CO2, USGS scientists are providing a foundation for predicting future impacts of ocean acidification and sea-level rise to coral reefs.
Increased dust storm activity may result from enhanced aridity in the Southwest, according to a USGS study.
Provide your input on the draft USGS Global Change Science Strategy by April 8, 2011.
Sea-ice habitats essential to polar bears would likely respond positively should more curbs be placed on global greenhouse gas emissions, according to a new modeling study published today in the journal, Nature.
Landscape photos taken in the same place but many years apart reveal dramatic changes due to human and natural factors. The USGS Desert Laboratory Repeat Photography Collection, the largest archive of its kind in the world, is 50 years old.
Decreasing pH and warming temperatures are changing ocean conditions and affecting coral and algal growth in South Florida. USGS scientists are conducting field measurements to learn more.
Many coastal wetlands worldwide including several on the U.S. Atlantic coast may be more sensitive than previously thought to climate change and sea-level rise in the this century.
USGS findings support recent predictions that climate change will stress ecosystems at lower elevations more than higher elevations. This information may guide future conservation efforts in helping decision makers develop regional landscape predictions about biological responses to climate changes.
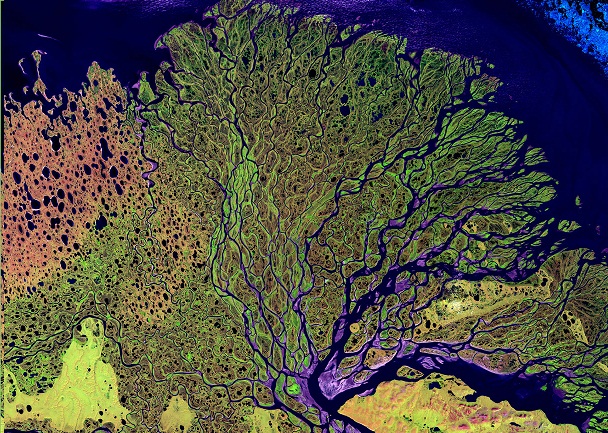
The Earth as Art 3 collection, the latest set of Landsat satellite images selected for their artistic quality, reveals an intricate beauty in Earth’s natural patterns.
USGS scientists are investigating sea turtles and their habitats in Dry Tortugas National Park to provide insight that will be used as decision-support tools for managing coral ecosystems.
Looking for information on natural resources, natural hazards, geospatial data, and more? The USGS Education site provides great resources, including lessons, data, maps, and more, to support teaching, learning, K-12 education, and university-level inquiry and research.
The timing of animal migration and reproduction, and observing when plants send out new leaves and bear fruit, is increasingly important in understanding how climate change affects biological and hydrologic systems. Photo credit Copyright C Brandon Cole.
The United States Group on Earth Observations (USGEO) is working to connect Earth observations with public health, agriculture, climate, and data management and dissemination.
USGS studies the relationships among earth surface processes, ecological systems, understanding current changes in the context of prehistoric and recent earth processes, distinguishing between natural and human-influenced changes, and recognizing ecological and physical responses to changes in climate.
The USGS Science Strategy is a comprehensive report to critically examine the USGS's major science goals and priorities for the coming decade. The USGS is moving forward with these strategic science directions in response to the challenges that our Nation's future faces and for the stewards of our Federal lands.

January 24th at 7 p.m. (PST) — Public Lecture information: http://online.wr.usgs.gov/calendar

7 p.m.—Public lecture (also live-streamed over the Internet)

7 p.m.—Public lecture (also live-streamed over the Internet)

7 p.m.—Public lecture (also live-streamed over the Internet)

There are now over 60,000 maps and publications for sale for only a dollar now through May 7!

The U.S. Geological Survey had a very busy 2011 — below are a few of our highlights from last year.
7 p.m.—Public lecture (also live-streamed over the Internet)

USGS-led survey finds that national wildlife refuges rate highly with visitors.

As the climate has warmed, many plants are starting to grow leaves and bloom flowers earlier. A new study published in the journal, Nature, suggests that most field experiments may underestimate the degree to which the timing of leafing and flowering changes with global warming.

Stressed agricultural lands may be releasing less of the moisture needed to protect the breadbasket of a continent.

Spring rains in the eastern Horn of Africa are projected to begin late this year and be substantially lower than normal.

In recognition of World Forestry Day, let’s take a glimpse at USGS science to understand the fate of forests from climate change.

A new study concludes that fossil fuel emissions are likely contributors to a substantial amount of organic carbon found on glaciers in Alaska. Fossil fuel emissions, which contain organic carbon, can speed up the rate of glacier melt when deposited on glacier surfaces. In addition, the organic molecules associated with these deposits can be transportedContinue Reading
The U.S. Geological Survey had a very busy 2011 — below are a few of our highlights from last year.

Despite news articles warning of large-scale releases of methane due to climate change, recent research indicates that most of the world’s gas hydrate deposits should remain stable for the next few thousand years.
Join us on February 1 to view the Earth from space, and discuss the profound impact Landsat has on many facets of our economy, safety, and environment.

Scientists have discovered an outbreak of coral disease called Montipora White Syndrome in Kāneohe Bay, Oahu. The affected coral are of the species Montipora capitata, also known as rice coral.
USGS scientists will join thousands of scientists, managers, and decision makers in Boston this week to present new findings on toxics at the Society for Environmental Toxicology and Chemistry (SETAC) conference in the Hynes Convention Center, Nov. 13-17.

On Nov. 3, USGS scientists Patrick Barnard and William Ellsworth will present a public lecture in Menlo Park, CA, providing Bay Area residents information about USGS research in the San Francisco Bay Area, including recent discoveries beneath San Francisco Bay and ongoing studies to better understand earthquake probabilities and the potential hazards associated with strong ground shaking.

Rivers and streams in the United States are releasing substantially more carbon dioxide into the atmosphere than previously thought.

Climate Change Impacts to Tribal Communities The USGS is working with Native American communities and organizations to understand climate change impacts to their land and neighborhoods. Projects include interviews with indigenous Alaskans to understand their personal observations of climate change, as well as studying how climate change is impacting sand dunes and posing risksContinue Reading

As climate changes, it affects the timing of when leaves emerge, the amount of foliage that grows as well as the timeframe when leaves begin to fall.

How will accelerated glacial melting over the next 50 years as a result of climate change affect the unique Gulf of Alaska and Copper River coastal ecosystems? USGS scientists are studying these processes and impacts.

USGS scientists are assessing the potential to remove CO2 from the atmosphere for storage in other Earth systems through a process called carbon sequestration.

![]() U.S. Department of the Interior |
U.S. Geological Survey
U.S. Department of the Interior |
U.S. Geological Survey
URL: www.usgs.gov/blogs/features/usgs_top_story/the-last-piece-of-the-puzzle-usgs-historical-maps/
Page Contact Information: Ask USGS
Page Last Modified: September 14, 2011


