Skip to content
UNITED STATES DEPARTMENT OF LABOR
Employment & Training Administration
A to Z
|
Site Map
|
FAQs
|
Forms
|
About DOL
|
Contact Us
|
Español
ETA Home
Find Job & Career Info
Business & Industry
Workforce Professionals
Grants & Contracts
TAA Program
Foreign Labor Certification
Performance & Results
Regions & States
ETA Home
Performance and Administration>
charts>
A-Z Resources
What's New, What's Hot
Guidance for Planning Performance
Common Measures
Laws & Regulations
Questions and Answers
Performance Goals
GPRA
States' Negotiated Levels of Performance
Performance Results
Individual Program Results
Quarterly Workforce System Results
WIA Annual Results
Reporting
Forms
Data Validation
Training and Tutorials
WIASRD Tutorial
Archives
Reporting &
Validation
Common Measures
Program Reporting
Data Validation
Performance
Results
ARRA
Charting Performance
Individual Program Results
Quarterly Workforce System Results
WIA Annual Performance Reports
WIASRD Reports
Guidance &
Regulations
Incentives and Sanctions
Negotiation
Regulations
TEGLs & TENs
Performance
Planning
State WIA W-P Plans
WIA Annual Report Narratives
State Negotiated Performance
GPRA
Training &
Tutorials
WIASRD Tutorial
Performance and Fiscal Tutorials
Wage Record
Systems
WRIS
WRIS2
CRIS
FEDES
Workforce Data
Quality Initiative
Grant Information
Grantee Information
Technical Assistance
Charting Performance
Click on each below links for larger view and click on the charts for more detail
Archived Charts
On February 1, when we wear red for women's heart health ETA highlights the women served through programs.
Post 9/11 Era Veterans Receiving Services In The Wagner-Peyser Employment Service
ETA Internet-Based Assistance (E-Tools)
National Reading Day: March 2, 2012
African Americans Served by ETA Programs in PY 2010
African Americans Served by ETA Programs in PY 2010
Female Exiters by WIA Program PY2008-2010
1,823,937 Veterans Served in ETA Programs
Program Year 2009 Workforce Investment Act Section 503 Incentive Grants
Entered Employment Rate (EER) for Veterans in the WIA Adult & Dislocated Worker Programs
Entered Employment Rate for Veterans who received training: Top Ten States
Veterans who received Training and Entered the Work force in Program Years (PY) 2008 and 2009
Entered Employment Rate (EER) for Veterans and All Exiters in the WIA Adult & Dislocated Worker Programs
Entered Employment Rate (EER) for WIA Adult & Dislocated Worker Program
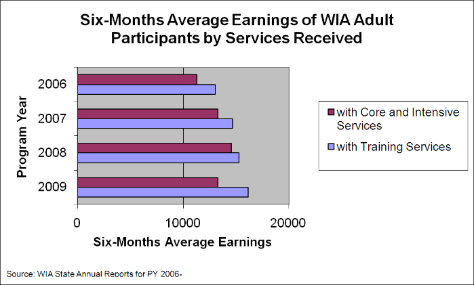
Six Months Earnings of WIA Adult Participants by Services Received
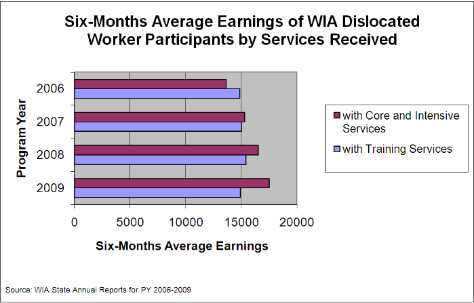
Six Months Average Earnings of WIA Dislocated Worker Participants by Services Received
PY08 Incentive Statess
Women Served by the Workforce System in the 4 Quarters Ending September, 2009
WIA Participants Programs PY 2004 - 2008
Women Served by WIA Programs PY 2006 - 2008
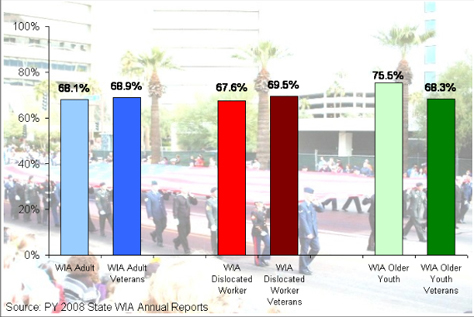
Entered Employment Rate for WIA Exiters Program and Veteran Status PY 2008
People Served Asian Pacific Americans
African-Americans Served by the Workforce System (Four Quarters Ending September 30, 2008)
Women Served Chart 2005-2007
Monthly Unemployment Rate January 2003 - December 2008
Asian Pacific Americans Served by the Workforce System
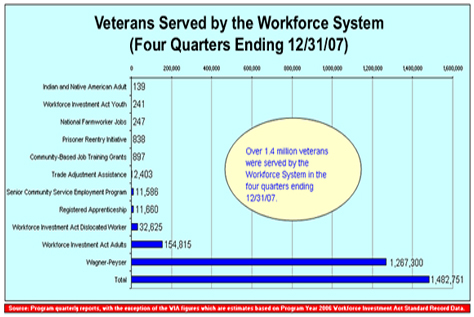
Veterans Served by the Workforce System
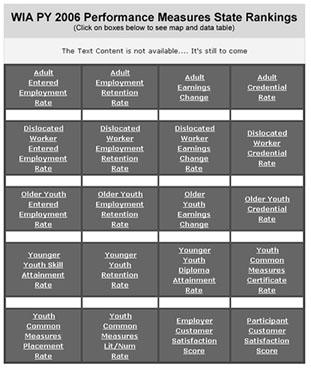
WIA PY 2006 Performance Measures State Rankings
African-Americans Served Chart-2007
WIA Participant Chart 2002-2006
Women Served by the Workforce System
Veteran's Day-2006
Veteran's Day-2007
Veteran's Day-2005
Women Served by the Workforce System in the four quarters ending 09/30/06
Blank form
Manual:
Auto:

")
")