Maps and Data
Find maps and charts showing transportation data and trends related to alternative fuels and vehicles.
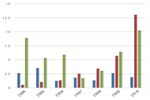
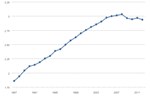
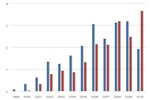
AFV Acquisitions by Regulated Fleets (by Fuel Type)
| 1992 | 1993 | 1994 | 1995 | 1996 | 1997 | 1998 | 1999 | 2000 | 2001 | 2002 | 2003 | 2004 | 2005 | 2006 | 2007 | 2008 | 2009 | 2010 | |
| Hydrogen | 0 | 0 | 0 | 0 | 0 | 0 | 0 | 0 | 0 | 0 | 1 | 0 | 0 | 3 | 7 | 2 | 1 | 0 | 3 |
| CNG | 11 | 1637 | 2719 | 3513 | 2322 | 2208 | 1890 | 3031 | 3812 | 3400 | 2679 | 1937 | 1662 | 682 | 563 | 713 | 354 | 247 | 382 |
| E85 | 0 | 102 | 92 | 185 | 474 | 1734 | 2105 | 3500 | 8469 | 5973 | 6319 | 5402 | 5677 | 9294 | 12100 | 14194 | 20611 | 10424 | 9569 |
| LNG | 0 | 0 | 2 | 0 | 3 | 0 | 0 | 1 | 1 | 1 | 0 | 0 | 0 | 1 | 0 | 4 | 5 | 0 | 0 |
| Propane | 0 | 560 | 1281 | 1603 | 1641 | 1545 | 1351 | 731 | 1370 | 866 | 961 | 564 | 607 | 150 | 17 | 7 | 10 | 19 | 5 |
| Methanol (M85) | 0 | 132 | 56 | 23 | 130 | 579 | 401 | 149 | 0 | 0 | 0 | 0 | 0 | 0 | 0 | 0 | 0 | 0 | 149 |
| Electric | 16 | 52 | 171 | 118 | 61 | 251 | 372 | 595 | 351 | 392 | 353 | 376 | 155 | 92 | 151 | 220 | 175 | 104 | 268 |
Source: National Renewable Energy Laboratory
Under the Energy Policy Act of 1992 (EPAct) and subsequent regulations, certain vehicle fleets operated by state agencies or alternative fuel providers are required to acquire alternative fuel vehicles (AFVs). This chart shows the number of AFV acquisitions these fleets made from 1992 to 2010. Flex fuel vehicles that operate on high-level blends of ethanol continue to be the most frequently acquired vehicle. This is likely because vehicle manufacturers offer the most frequently acquired models with the flex fuel option. In comparison, as of MY2011, there was only one natural gas sedan available for purchase. In addition, the marginal cost increase of acquiring a flex fuel vehicle over a conventional gasoline vehicle is minimal or nonexistent.