Maps and Data
Find maps and charts showing transportation data and trends related to alternative fuels and vehicles.
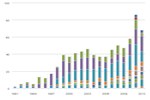
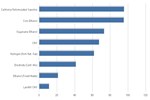
Carbon Intensity of Alternative Fuels in California Heavy-Duty Vehicles
| ULSD | LNG | Biodiesel (Soy) | Renew. Diesel (Soy) | CNG | Hydrogen (NG) | Electricity | Renew. Diesel (Tallow) | Biodiesel (Grease) | Dairy CNG | Landfill CNG | |
| Total Carbon Intensity | 94.71 | 92.37 | 83.25 | 82.16 | 75.22 | 74.8 | 45.959999999999994 | 39.33 | 15.84 | 13.5 | 12.51 |
Source: California's Low Carbon Fuel Standard Final Regulation Order, April 15, 2010 www.arb.ca.gov/regact/2009/lcfs09/lcfscombofinal.pdf
Notes: Emissions data is based on analysis from California's Low Carbon Fuel Standard Final Regulation Order, April 15, 2010
This chart compares the intensity of life cycle greenhouse gas (GHG) emissions of various alternative fuels in heavy-duty vehicles. Alternative fuels with the greatest life cycle GHG benefits are CNG derived from landfills, CNG from dairy farms, and biodiesel produced from waste grease.
Emissions levels of some fuels vary by region, so data presented here may not be representative of those in other areas of the country.