Maps and Data
Find maps and charts showing transportation data and trends related to alternative fuels and vehicles.
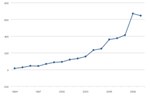
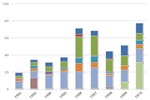
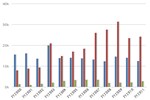
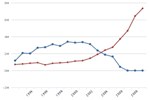
U.S. Biodiesel Production, Exports, and Consumption
| 2001 | 2002 | 2003 | 2004 | 2005 | 2006 | 2007 | 2008 | 2009 | 2010 | 2011 | |
| Production | 8.577 | 10.484 | 14.21 | 27.982 | 90.787 | 250.439 | 489.825 | 678.106 | 515.802 | 343.434 | 967.4280000000001 |
| Net Exports | -1.63632 | -5.684448 | 0.6769559999999999 | 1.1040539999999999 | -0.0399 | -10.14447 | 131.668656 | 362.31031199999995 | 188.519982 | 82.23033 | 36.899688000000005 |
| Consumption | 10.213 | 16.168 | 13.533 | 26.878 | 90.827 | 260.584 | 358.156 | 315.796 | 325.5 | 262.836 | 878.43 |
Source: EIA Annual Energy Review, 2011 Table 10.4 from the U.S. Energy Information Administration
This chart shows trends in U.S. biodiesel production, exports, and consumption from 2001 to 2011. Exports of biodiesel peaked in 2008 largely due to a perverse effect of a biodiesel tax credit in the European Union. Exports then dropped after the effect was eliminated. The record production and consumption in 2011 was largely to meet the Renewable Fuel Standard.