Related BLS programs | Related articles
![]()
October 2010, Vol. 133, No. 10
The impact of the 2007–09 recession on workers with disabilities
H. Stephen Kaye, Ph.D.
H. Stephen Kaye is an associate professor, Department of Social and Behavioral Sciences and Institude for Health and Aging, University of California, San Francisco. Email: Steve.kaye@ucsf.edu
![]()
New data available from the Current Population Survey (CPS) indicate that between October 2008 and June 2010, job losses among workers with disabilities far exceeded those of workers without disabilities; this labor market volatility resulted in the proportion of employed U.S. workers identified as having disabilities declining by 9 percent.
Researchers have asserted that workers with disabilities are "the last hired and first fired,"1 suggesting that the employment of people with disabilities is particularly procyclical, meaning that workers with disabilities "may be the first to be laid off in a recession and the last to be hired when conditions improve."2 Although this claim has yet to be proved, various studies have shown that workers with disabilities are much more likely than workers without disabilities to have short-term jobs or work as contractors,3 to perceive their jobs as less than secure,4 and to experience job losses and periods of unemployment,5 partly because workers with disabilities are more often employed in occupations with lower status and less stability.6
During and immediately following recessions, applications for Federal disability benefits rise markedly,7 and new benefit awards generally increase as well.8 Many people with disabilities exit the labor force permanently during economic downturns. Benefits can provide a safety net for people who may have always been eligible for them but who stayed in the labor force as long as the opportunity lasted. Or there may be a more complex relationship between recession and disability: some researchers argue that economic downturns, which have been shown in some studies to cause mental and perhaps physical health conditions that could exacerbate or cause disability, may result in increased disability among labor force participants, reducing perceived ability to work and motivating people to seek benefits rather than jobs.9
The recent recession, which officially began in December 200710 but did not substantially affect unemployment rates until mid-2008,11 has resulted in the largest four-quarter percentage decline in gross domestic product since 194612 and the highest rates of unemployment since 1983.13 Although the effect of prior recessions on employment of the general population has been extensively studied, research on the effect of recessions on workers with disabilities has been limited by lack of data collection on the employment experiences of people with disabilities, either because surveys and administrative data sources did not have means of identifying labor force participants with disabilities, or because the existing disability measures were inadequate or inappropriate for the purpose.14
With its large, monthly sample of U.S. households and its reputation as an accurate and reliable source of employment statistics, the Current Population Survey (CPS) is the ideal vehicle for tracking the workforce with disabilities in a fluctuating economy. Until recently, the CPS lacked any means of identifying workers with disabilities (except for people declaring themselves completely unable to work due to disability), and had only a controversial, unvalidated annual measure designed for survey administration purposes.15 In response to a 1998 Executive order mandating better measurement of the employment rate of people with disabilities,16 the Bureau of Labor Statistics (BLS) introduced a tested and validated measure of disability status17 into the CPS monthly survey in mid-2008.18 It is now possible to track month-to-month changes in the employment levels of people with various types of disabilities, with only a few weeks’ lag between data collection and analysis. The new survey measures even allow for tracking individual respondents as their labor force status changes from month to month.
Using these unprecedented data, this article compares the labor force experiences of a large and well-selected sample of workers with disabilities with those of their nondisabled peers, during the most severe economic downturn in many decades. The analysis attempts to discover whether workers with disabilities are indeed the first to be fired and the last to be hired in bad economic times.
The CPS is a nationally representative monthly survey of about 54,000 households, conducted by the U.S. Census Bureau and BLS.19 The basic monthly survey provides a comprehensive body of data on labor force participation and earnings, and serves as the source of official statistics on employment and unemployment rates. Every month, initial interviews are conducted with a representative sample of U.S. households, and then the same households are interviewed again in each of the next 3 months; those households are then reinterviewed during the same 4 calendar months of the following year. Thus, the labor force status of each respondent can be tracked over 4 consecutive months or from year to year, if the respondent is available for the follow-up interviews.
The CPS disability measure is made up of six questions pertaining to limitations in hearing, vision, ambulation, cognition, self-care, and getting around in the community. BLS warns against comparing responses beginning in October 2008 with those of the previous 4 months because of a change in administration of the questions;20 the analysis in this article is therefore limited to respondents identified as having (or not having) disabilities in October 2008 and thereafter. Household members reported as having any of the six limitations were classified as having disabilities; those reported as having difficulty in performing self-care ("dressing or bathing") or other routine activities ("doing errands alone such as visiting a doctor’s office or shopping") are classified as having limitations in daily activities, a more significant level of disability that may require help from other people to perform such activities. In addition to labor force status indicators, the monthly survey also contains information on the occupation and industry of employment, both of which were used in this analysis.
To evaluate the impact of the recession across industries for this study, an analysis of layoffs and other involuntary discharges was performed using data from the Job Openings and Labor Turnover Survey (JOLTS), also conducted by BLS.21 JOLTS data are collected monthly from a sample of approximately 16,000 U.S. nonfarm employers, including government agencies at all levels. The monthly layoff/discharge rate for the entire nonfarm economy increased dramatically between September 2008 (when it was 1.5 percent, a typical value for September) and January 2009 (when it was 2.9 percent, about 1 percentage point above the typical January level), and remained unusually high through most of 2009. For the 18 major industry categories covered by JOLTS, the impact of the recession on the industry can be assessed by comparing the ratio of the average rate of layoffs over the 12-month period beginning October 2008 with the average over a 2-year period during the economic expansion (October 2005–September 2007). Industries experiencing a greater proportional increase in layoffs and other discharges than that for the entire nonfarm economy were classified as highly affected industries,22 with the remainder classified as less affected industries.23 To separate out much of the inherently seasonal variation, a third category was created for highly seasonal industries, which are easily identified by a strong cyclical pattern in job layoffs and discharges.24
For the analysis of occupational differences in employment trends, the 504 occupations identified in the CPS (variable PEIO1OCD) were collapsed into 3 categories based on the amount of advance preparation (education and training) required to obtain a job in the occupation. Information on occupational preparation requirements were obtained from the O*NET database25 of occupational characteristics, sponsored by the U.S. Department of Labor. Based on O*NET’s "job zones" categories, occupations were classified as low skill (the "some preparation" and "little or no preparation" job zones, in which prior experience might be helpful but is generally not necessary, and college degrees are generally not required), medium skill (requires on-the-job experience or an apprenticeship, and often a bachelor’s or associate’s degree), and high skill (the "considerable" and "extensive preparation" O*NET categories, generally requiring several years of on-the-job experience and at least a bachelor’s degree). The O*NET occupational classifications are more detailed than those of the CPS; in some cases, job zone ratings for multiple O*NET occupations were averaged to obtain a rating for a single CPS occupational category.
To track month-to-month changes in an individual’s employment status, the sample from each month was restricted to respondents in the longitudinal sample (that is, records with nonzero longitudinal weights), indicating that the current month is at least their second consecutive interview month. First-time survey respondents (members of households newly selected into the sample, members of replacement households, and new members of continuing households) were excluded, as were those returning to the sample after a gap (typically the 8-month gap between interviews 4 and 5). The longitudinal sample comprises 71.3 percent of the working-age sample, and has been reweighted by BLS to represent the U.S. working-age population. After each record was matched with the corresponding record in the prior month’s sample, 0.7 percent of such records were dropped because the recorded age or sex of the respondent changed from one month to the next (apart from a possible 1-year increase in age), and a further 0.6 percent were dropped because the labor force status had been imputed in either or both months.
Sampling weights were used throughout the analysis, and standard errors for all estimates were calculated using the formulas provided by BLS.26 The statistical significance of trends was estimated by computing the difference in chi-squares of a fit with a linear trend and a fit without a trend. The chi-square was obtained using the square of the formula-derived standard errors in the denominator, a standard method for analyzing goodness-of-fit when the data have predetermined standard errors;27 the resulting chi-square difference has the properties of a chi-square with a single degree of freedom.
| Category | With disability | No disability | ||
|---|---|---|---|---|
| October 2008 | June 2010 | October 2008 | June 2010 | |
Population (millions) |
14.7 | 14.3 | 173.3 | (1)175.9 |
Percent of working-age population |
7.8 | (2)7.5 | 92.2 | (2)92.5 |
Age and sex |
||||
Mean age |
47.7 | (1)48.0 | 39.8 | (2)39.9 |
Percent female |
50.4 | 51.0 | 50.7 | 50.7 |
Race/ethnicity(3) (percent) |
||||
White |
80.6 | 80.9 | 81.5 | (1)81.2 |
African American |
16.4 | (2)16.0 | 12.6 | (1)12.9 |
Asian/Pacific Islander |
2.2 | 2.2 | 5.7 | 5.9 |
American Indian/Alaska Native |
2.8 | 3.3 | 1.5 | 1.5 |
Latino/Hispanic |
10.4 | (1)11.3 | 15.4 | (2)15.6 |
Education |
||||
College graduates (percent) |
13.4 | (1)14.6 | 29.7 | 29.7 |
Labor force participation |
||||
Participants (millions) |
5.4 | (1)4.9 | 140.9 | 141.3 |
Employed |
4.7 | (1)4.2 | 132.8 | (1)128.3 |
Unemployed (looking for work) |
0.6 | (1)0.8 | 8.2 | (1)13.0 |
Perceives unable to participate (percent) |
44.9 | (1)47.6 | 2.0 | (1)2.3 |
|
Footnotes: |
||||
Demographic and socioeconomic characteristics. Table 1 shows the size and selected characteristics of the working-age populations with and without disabilities in October 2008 and June 2010. As compared with other major national surveys, the CPS identifies a substantially smaller proportion of working-age adults as having disabilities (7.8 percent at the start of the period and 7.5 percent at the end). The 2008 American Community Survey yields an estimate of 10.1 percent; the estimate from the 2007 survey, which used an older set of questions, is 12.4 percent.28 The 2008 National Health Interview Survey yields an estimate of 10.8 percent,29 and the estimate from the Survey of Income and Program Participation is 16.5 percent, using 2005 data and a much broader measure of disability.30 The difference in reported disability rates between the beginning and end of the period reflects a small downward trend in disability prevalence that is modestly statistically significant.
The mean age of the population with disabilities is about 8 years older than that of the population without disabilities; for both groups, the average age increased significantly over the October 2008–June 2010 period, with a larger, though relatively modest, increase among those with disabilities. African Americans and especially American Indians and Alaska Natives are overrepresented in the population with disabilities, while Asians and Pacific Islanders and Latinos are underrepresented, statistics that are consistently found in most national surveys.31 In addition, educational attainment is generally much lower among the population with disabilities than among those without disabilities. This educational gap seems to be narrowing, however, with a substantial increase over the 20-month period in the proportion of working-age adults with disabilities who are college graduates.
Despite relatively modest changes in the number and demographic characteristics of working-age adults with disabilities over the period between October 2008 and June 2010, there was a substantial drop in labor force participation among this group, from 5.4 million to 4.9 million. In contrast, there was no statistically significant change in the number of labor force participants without disabilities. The size of the employed workforce decreased for both groups, but by a far greater amount for those with disabilities: those with disabilities experienced a 12.3 percent decline, from 4.7 million to 4.2 million, compared with a 3.4 percent drop for working-age adults without disabilities. There were large and statistically significant increases in the number of unemployed labor force participants with and without disabilities.
There is a marked increase over the period in the proportion of working-age adults with disabilities who see themselves as unable to participate in the labor force. This category includes people who say they are unable to work or who say that disability or ill health prevents them from seeking employment. It is interesting to note that 2.0 percent of people identified as not having disabilities said they were unable to work or seek employment; by the end of the 20-month period, this number rose to 2.3 percent. Although the proportion is small, the number of people is substantial; in June 2010, 4.0 million people cited disability as a reason for not participating in the labor force but did not endorse any of the six newly added functional measures. In fact, of those people whose labor force status is listed as "disabled" in the dataset, only 67.5 percent are captured by the new disability measure.
Proportion of workforce reporting disabilities. The decreasing workforce disability rate illustrates the disproportionate impact of the recession on workers with disabilities. As indicated in chart 1 and table 2, that proportion of workers who have disabilities dropped from an initial 3.44 percent in October 2008 to 3.12 percent one year later in October 2009, with most of that decline occurring in mid-2009. After returning briefly to nearly its initial value early in 2010, the proportion drops to 3.14 by June 2010. These declines are highly statistically significant; they amount to a nearly 10 percent decline in people with disabilities in the workforce over the course of 1 year.
| Category | Workforce indentified as having disabilities |
Rate of employment among working-age adults with disabilities |
||||||||
|---|---|---|---|---|---|---|---|---|---|---|
| Oct. '08 | Oct. '09 | June '10 | Percent change | Oct. '08 | Oct. '09 | June '10 | Percent change | |||
| Oct. '08- Oct. '09 |
Oct. '08- June '10 |
Oct. '08- Oct. '09 |
Oct. '08- June '10 |
|||||||
| Percent | Percent of Oct. '08 value |
Percent | Percent of Oct. '08 value |
|||||||
Any disability |
3.44 | 3.12 | 3.14 | (2) -9.5 | (2)-8.9 | 32.2 | 28.4 | 29.0 | (2)-11.8 | (2)-9.9 |
Hearing |
1.15 | 0.99 | 1.03 | −14.0 | (3)-10.6 | 55.4 | 47.7 | 48.2 | (2)-13.8 | (2)-13.0 |
Vision |
0.51 | 0.51 | 0.56 | 0.1 | 10.4 | 33.2 | 33.2 | 36.2 | 0.0 | 8.9 |
Mobility |
1.36 | 1.23 | 1.12 | (2) -9.3 | (2)-17.8 | 22.9 | 20.1 | 18.9 | (2)-12.1 | (2)-17.4 |
Cognitive |
0.91 | 0.83 | 0.79 | (2)-8.8 | (2)-12.9 | 23.3 | 20.5 | 20.9 | (2)-11.8 | (2)-10.4 |
Daily activities |
0.51 | 0.42 | 0.43 | (2)-19.0 | (2)-16.7 | 14.1 | 11.1 | 11.6 | (2)-20.8 | (2) -17.3 |
No disability |
— | — | — | — | — | 76.7 | 72.7 | 72.9 | (2)-5.2 | (2)-4.9 |
Age group |
||||||||||
18–39 |
2.20 | 1.93 | 1.81 | (2) -12.1 | (2)-17.5 | 39.1 | 32.6 | 33.3 | (2) -16.6 | (2) -14.8 |
40–54 |
3.77 | 3.47 | 3.36 | −7.9 | −10.8 | 34.4 | 32.1 | 29.9 | (2) -6.7 | (2)-13.2 |
55–64 |
6.42 | 5.69 | 6.39 | −11.3 | −0.4 | 25.1 | 21.9 | 25.4 | −12.8 | 0.9 |
Sex |
||||||||||
Men |
3.54 | 3.07 | 3.15 | (2)13.4 | (3)-11.0 | 35.4 | 29.8 | 31.5 | (2) -15.9 | (2) -11.2 |
Women |
3.33 | 3.17 | 3.11 | −4.8 | (2) -6.4 | 29.0 | 27.0 | 26.6 | (2) -6.8 | (2) -8.3 |
Education |
||||||||||
No high school diploma |
4.95 | 4.48 | 3.96 | (2)-9.5 | −20.0 | 18.1 | 15.8 | 16.3 | (2)-12.5 | −10.1 |
High school graduate |
3.83 | 3.53 | 3.46 | −7.6 | (2)-9.5 | 32.7 | 28.7 | 28.5 | (2) -12.2 | (2)-12.9 |
College graduate |
2.34 | 2.06 | 2.34 | (2)-11.8 | −0.1 | 53.0 | 46.8 | 49.2 | (2) -11.7 | (2)-7.0 |
|
Footnotes: |
||||||||||
Table 2 also shows the employment rate (technically the employment-to-population ratio, or the proportion of working-age adults who have jobs) for working-age adults with and without disabilities. The initial 32.2 percent employment rate of working-age adults with disabilities is less than half that of their nondisabled counterparts, and the proportional decline (11.8 percent over one year and 9.9 percent over the entire 20-month period) is more than twice that of working-age adults without disabilities.
There were statistically significant declines in the rates of all measured types of disability except visual impairment, which was also the only disability population not to experience a decline in its employment rate. People with limitations in their ability to perform daily activities had the lowest employment rate of any group by far at the start of the period, and experienced the largest declines in both rate of employment and rate of reported disability in the workforce.
Workers under 40 years old with disabilities were faced with the brunt of the recession’s disproportionate impact; the proportion of workers between the ages of 18 and 39 reporting disabilities dropped by 17.5 percent over the period. The apparent decline for those 40 to 54 years of age fails the statistical test for a linear trend, even though this population also faced a large and statistically significant employment rate decline. Perhaps surprisingly, people with disabilities between 55 and 64 years of age appear to have been mostly protected from the impact of the recession, with no statistically significant declines in either employment rate or representation in the workforce.
Both men and women with disabilities were disproportionately affected by the recession, but the proportion of employed men reporting disabilities dropped by nearly twice that of women, as shown in table 2. The disproportionate impact of the recession was felt across all levels of educational attainment, with significant and large declines in the reported rate of disability even among those with college degrees. That group, however, appears to have recovered more quickly than those with less education, with the rate returning to nearly its original level by the end of the period.
Variation in impact of the recession by industry. Some industries were profoundly affected by the recession, with a large wave of layoffs occurring as early as December 2008 or January 2009; other industries did not feel the force of the recession until mid-2009. In industries that were highly affected and are not particularly seasonal (based on data on layoffs and other involuntary discharges; see the "Data and Methods" section for details), the proportion of workers identified as having disabilities gradually declined from an initial 3.2 percent to reach a low of 2.8 percent at the end of 2009, then recovered to slightly above its initial value, and subsequently fell to a new low of 2.7 percent in June 2010 (chart 2). In less affected, nonseasonal industries, there was also a decline in the rate of identified disability, but it was more modest and did not begin until the second half of 2009. Industries with a seasonal pattern of hiring and layoffs show greater volatility in the proportion of workers with disabilities than in either of the nonseasonal classifications.
Occupational differences. The impact of a recession on an individual worker depends not only on the type of employer he or she works for, but also on the kind of work he or she does. As shown in chart 3, workers with disabilities have a much greater presence in low-skill occupations than in medium-skill occupations, and in medium-skill than in high-skill occupations. Among people employed in low-skill occupations (often found in highly seasonal industries) there is an early increase in the proportion of workers identified as having disabilities (from 4.0 percent in October 2008 to 4.3 percent in March 2009), followed by a gradual decline and a leveling off, reaching a low of 3.7 percent at the end of the period. Among workers employed in medium-skill occupations, there is a modest initial decline in the rate of identified disability from 3.5 percent in October 2008 to 3.2 percent in January 2009, and then a rather precipitous decline in mid-2009 to 2.8 percent in August; the rate increases temporarily and then falls again to a final value of 2.9 percent in June 2010.
In contrast to the large declines in the representation of workers with disabilities in low-skill and medium-skill occupations, there is no evidence of any disproportionate impact of the recession on workers in high-skill occupations. The apparent, temporary decline in the rate of identified disability is not statistically significant, and the final value of 2.5 percent is unchanged from the initial value. In addition to the protection that their greater job skills impart, most high-skill workers are employed in industries that were less affected by the recession.
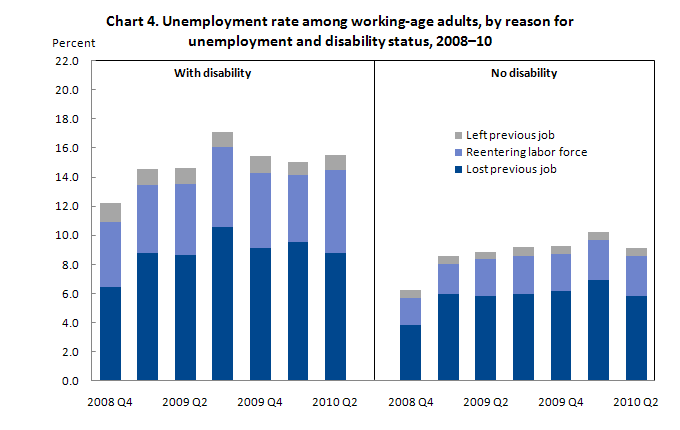
Unemployment rates. The unemployment rate (the proportion of working-age labor force participants who are either actively looking for work or waiting to return to work following a short-term layoff) is indicated by the total height of the bars shown in chart 4. During the final quarter of 2008, the unemployment rate for labor force participants with disabilities was 12.2 percent. By the third quarter of 2009, that rate had risen by 4.9 percentage points to 17.1 percent, meaning that more than one-sixth of labor force participants with disabilities were not working. There was a subsequent decline of more than 1 percentage point, with the rate leveling off to reach a value of 15.5 percent in the second quarter of 2010.
In contrast to the 4.9-percentage-point increase during the first three quarters of 2009, the unemployment rate for working-age labor force participants without disabilities increased by a much smaller value—2.9 percentage points—from an initial value of 6.3 percent to 9.2 percent. The rate continued to increase, reaching 10.2 percent in the first quarter of 2010 and falling back to 9.2 percent in the second quarter.
Chart 4 also shows the proportions of labor force participants who are unemployed following voluntary departure from a job, a first-time entry or reentry into the labor force, and job loss. Loss of a job, including temporary layoff, is the principal reason for unemployment among labor force participants both with and without disabilities. Among those labor force participants with disabilities, the proportion of those unemployed because of job loss increased 4.1 percentage points between the fourth quarter of 2008 (6.5 percent) and the third quarter of 2009 (10.6 percent). Labor force participants without disabilities saw just over half that increase, 2.1 percentage points, over the same period.
Voluntary termination of employment (and then remaining in the labor force to seek a new job) is relatively rare among both groups, and the rates are more or less steady over the period. In contrast, a much larger proportion of labor force participants with disabilities are unemployed following first-time entry or reentry into the labor force, compared to their nondisabled counterparts, with the proportions increasing by 1.3 percentage points for labor force participants with disabilities over the full period and 1.0 percent for those without disabilities.
Job exit and acquisition. The tenuous relationship between people with disabilities and the labor force is well illustrated in chart 5. Even at the start of the data collection period, when the effects of the recession were just beginning to emerge in the labor force, the rates of job exit (percent of people employed in the prior month who were no longer employed in the current month) and of job acquisition (percent of people employed in the current month who had not been employed in the prior month) are both at 6.1 percent for working-age adults with disabilities, almost twice the rates for working-age adults without disabilities, about 3.5 percent. In other words, over the course of one relatively typical month, about 1 of every 16 workers with disabilities lost (or left) their jobs and 1 of every 16 workers got jobs; the chart includes short-term or seasonal jobs as well as temporary layoffs and rehires. There is a great deal of transition in and out of employment among workers with disabilities, far exceeding that of their counterparts without disabilities.
Between October 2008 and January 2009, the job exit rate grows dramatically for people with disabilities, rising by 1.6 percentage points in November and a further 1.3 points by January 2009, when it reaches a high of 9.0 percent. In contrast, the exit rate for workers without disabilities remains steady through December and increases by a relatively modest 1.2 percentage points in January, reaching a high of 4.7 percent. January through April 2009 saw a dramatic decline in the exit rate for workers with disabilities (compared to a modest decline for those without disabilities) and then a dramatic increase (again, compared to a modest increase) from April to July 2009, followed by a gradual decline.
The rate of job acquisition also shows greater volatility for workers with disabilities than for those without. The latter varies by 1.2 percentage points, from a low of 2.8 percent in December 2008 to a high of 4.0 percent in September 2009, and then back down to 3.0 percent in December 2009. For workers with disabilities, there is a 3.1-pecentage-point variation over the period; December 2008 saw a temporary low of 5.0 percent, followed by much fluctuation, then an increase to a high of 7.7 percent in November 2009, and then a drop to a new low of 4.6 percent in the following month.
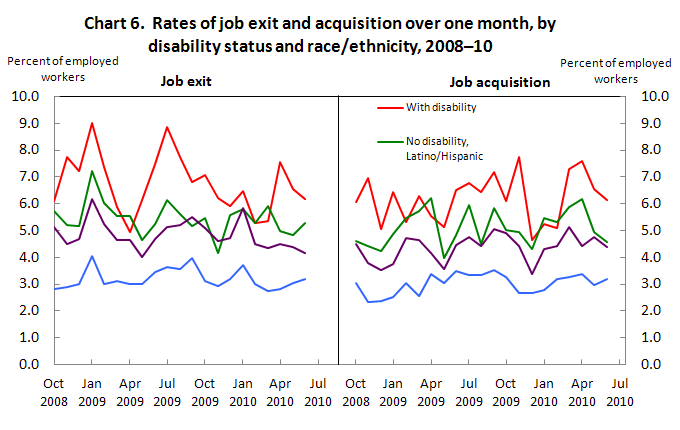
To determine whether workers with disabilities are the first to lose their jobs at the start of a recession and the last to be hired in the recovery, it is instructive to compare the job exit and acquisition rates of people with disabilities with those of racial and ethnic minority and majority groups. Rates in chart 6 are for four mutually exclusive categories of working-age adults: those with disabilities, those without disabilities of Hispanic or Latino origin, those without disabilities of non-Latino African American origin, and a comparison group of everyone else (those without disabilities who are neither Latino nor African American). As the chart shows, the disability and racial or ethnic minority populations all experienced higher rates of both job exit and job acquisition than the comparison group over the entire period, again indicating a more tenuous connection to the labor market. In general, however, rates for workers with disabilities are higher than those for the racial and ethnic minority groups, and show greater fluctuation over the period.
In particular, Latino and African American workers without disabilities experienced greater increases in job exits between October 2008 and January 2009 than did the comparison group (those without disability who are neither Latino nor African American), but these increases are less dramatic than those for workers with disabilities, and appear to have begun two months later than those for workers with disabilities. And when job exit rates increase once again for all groups in mid-2009, the population with disabilities sees a more pronounced increase than any of the other three groups—an increase that seems to begin one month earlier. The data on job acquisitions do not yet reflect large increases in hiring indicative of a substantial recovery, so it is not yet possible to address the "last hired" part of the assertion.
An analysis of trends over 21 months of data from the CPS reveals strong evidence that the 2007–09 recession has disproportionately affected workers with disabilities, resulting in a 9 percent decline in the presence of workers with disabilities in the employed labor force. Particularly affected were workers with mobility impairments (17.8 percent decline in their representation in the workforce between October 2008 and June 2010), workers with difficulty performing routine daily activities (16.7 percent decline), younger working-age adults with disabilities (17.5 percent for those ages 18–39), and workers with disabilities employed in medium-skill occupations (17.3 percent). Men with disabilities were more likely to experience the effects of the recession than women with disabilities, and people without college degrees were more affected than those workers who have college degrees. People with disabilities working in highly skilled occupations appear to have been the least affected throughout the period.
For the U.S. workforce as a whole, the proportion of workers identified as having disabilities experienced a small decline in late 2008, and then held more or less steady until a large drop in late summer of 2009. But a closer look at disability rates by industry reveals that, in nonseasonal industries highly affected by the recession, the presence of workers with disabilities declined gradually through the first half of 2009, while it held steady in other nonseasonal industries, which did not experience the burden of the recession until mid-2009. The rate of reported disability is more cyclical in seasonal industries, increasing in spring and early summer and then declining rapidly and increasing again late in the year.
The recent, substantial increase in new Social Security Disability awards32 suggests that many workers with disabilities who lost their jobs left the labor force rather than continuing to seek employment. But others persisted in looking for work long enough to result in a large and rapidly increasing unemployment rate: more than one-sixth (17.1 percent) of working-age labor force participants with disabilities were looking for work during the summer of 2009, compared to less than one-tenth (9.2 percent) of their nondisabled counterparts. Among both populations, a large majority of unemployed people lost their jobs, instead of leaving voluntarily or returning to the labor force after an absence. Despite a widespread belief that Government disability benefits provide an adequate safety net for working-age adults with disabilities—perhaps even an enticement to leave the labor force when times are tough33 —the very high rate of unemployment following job loss indicates that a large proportion of those losing jobs either need to remain in the labor force or choose to do so.
An advantage of the longitudinal aspect of the CPS is the ability to analyze month-to-month transitions into and out of employment, clearly illustrating the tenuous relationship that many workers with disabilities have with their jobs (perhaps partly because they are more likely to be employed in temporary, seasonal, or other lower-skilled jobs, making them more expendable). The rates of both job exit and acquisition for working-age adults with disabilities are about 80 percent higher over the period, on average, than those of their nondisabled counterparts. During January 2009, the worst single month for layoffs and other job losses, 9 percent of workers with disabilities lost or left their jobs, nearly twice the rate of job exit for workers without disabilities (4.7 percent). The January 2009 rates represent a 3-month increase of about 3 percentage points for workers with disabilities compared to just over 1 point for other workers—a clear indication of the especially high vulnerability of workers with disabiities to the early effect of an economic downturn. A similar pattern is repeated during a second wave of job loss that occurred in mid-2009.
This article offers clear evidence of the disproportionate effect that the 2007–09 recession had on workers with disabilities compared with their counterparts without disabilities. Does this evidence also support the hypothesis that people with disabilities are the first to be laid off in a recession and the last to be hired when conditions improve? It seems that people with disabilities are the first to be laid off: the upswing in job exit has a larger magnitude and occurs earlier for workers with disabilities than for even African American and Latino workers, and all three groups show a much larger effect than that seen among the nondisabled, nonminority population.
At the time of this writing it is too early to tell whether workers with disabilities are the last to be hired when conditions improve. Job acquisition rates through mid-2010 do not yet show any indication of a substantial, sustained increase in hiring of workers (with or without disabilities) that would signal a clear economic recovery, and unemployment rates remain high for both groups. When conditions do improve, it will be instructive to observe whether increases in hiring for workers with disabilities lag behind those of their counterparts without disabilities, which would indicate that this particularly disadvantaged population faces not only a deeper recession than other groups, but also a longer period from onset to recovery.
ACKNOWLEDGEMENT: This research was funded by the National Institute on Disability and Rehabilitation Research, U.S. Department of Education, under grant numbers H133A060033 to the Burton Blatt Institute at Syracuse University (Peter Blanck, Principal Investigator), H133A060098 to the Public Health Institute (Erica Jones, PI), and H133B080002 to the University of California, San Francisco (Charlene Harrington, PI).
1 See, for example, A. Sheldon, "Recession, radicalism and the road to recovery?" Disability & Society, 2009, pp. 667–71; Laura Trupin, Douglas S. Sebesta, Edward Yelin and Mitchell P. LaPlante, Trends in Labor Force Participation Among Persons with Disabilities, 1983–94 (U.S. Department of Education, National Institute on Disability and Rehabilitation Research, 1997).
2 Douglas Kruse and Lisa Schur, "Employment of People with Disabilities Following the ADA," Industrial Relations, 2003, p. 31.
3 Lisa Schur, "Dead end jobs or a path to economic well being? The consequences of non-standard work among people with disabilities," Behavioral Sciences and the Law, 2002, pp. 601–20, Lisa Schur, "Barriers or opportunities? The causes of contingent and part-time work among people with disabilities," Industrial Relations, October 2003, pp. 589–622.
4 L. Schur, D. Kruse, J. Blasi and P. Blanck, "Is Disability Disabling in All Workplaces? Workplace Disparities and Corporate Culture," Industrial Relations, July 2009, pp. 381–410.
5 E. H. Yelin and L. Trupin, "Disability and the characteristics of employment," Monthly Labor Review, May 2003, pp. 20–31.
6 H. Stephen Kaye, "Stuck at the bottom rung: Occupational characteristics of workers with disabilities," Journal of Occupational Rehabilitation, June 2009, pp. 115–28.
7 Annual Statistical Report on the Social Security Disability Insurance Program, 2000 (Social Security Administration, 2001); Annual Statistical Report on the Social Security Disability Insurance Program, 2009 (Social Security Administration, 2010).
8 David H. Autor and Mark G. Duggan, "The rise in the disability rolls and the decline in unemployment," Quarterly Journal of Economics, 2003, pp. 157–206.
9 H. Stephen Kaye, "Employment and the Changing Disability Population," in David C. Stapleton and Richard V. Burkhauser, eds. The Decline in the Employment of People with Disabilities: A Policy Puzzle (Kalamazoo, Michigan: W.E. Upjohn Institute for Employment Research, 2003).
10 National Bureau of Economic Research, "Business Cycle Expansions and Contractions," 2008, on the Internet at http://www.nber.org/cycles/cyclesmain.html.
11 Labor Force Statistics from the Current Population Survey: Unemployment rate (U.S. Bureau of Labor Statistics, 2009), on the Internet at http://data.bls.gov/cgi-bin/surveymost?ln.
12 National Income and Product Accounts Table 1.1.6: Real Gross Domestic Product, Chained Dollars (U.S. Department of Commerce, Bureau of Economic Analysis, 2009), on the Internet at http://www.bea.gov/national/nipaweb/SelectTable.asp.
13 Labor Force Statistics from the Current Population Survey: Unemployment rate (U.S. Bureau of Labor Statistics, 2009), on the Internet at http://data.bls.gov/cgi-bin/surveymost?ln.
14 R. Silverstein, G. Julnes and R. Nolan, "What policymakers need and must demand from research regarding the employment rate of persons with disabilities," Behavioral Science and The Law, 2005, pp. 399–448.
15 Thomas W. Hale, "The lack of a disability measure in today's Current Population Survey," Monthly Labor Review, 2001, pp. 38–40.
16 Federal Register (The White House, March 1998), "Executive Order 13078 of March 13, 1998: Increasing Employment of Adults With Disabilities," pp. 13111–13.
17 Matthew Brault and Sharon M. Stern, Evaluation Report Covering Disability—2006 American Community Survey Content Test Report P.4 (U.S. Department of Commerce, U.S. Census Bureau, 2007).
18 Labor Force Statistics from the Current Population Survey: New monthly data series on the employment status of people with a disability (U.S. Bureau of Labor Statistics, 2009), on the Internet at http://www.bls.gov/cps/cpsdisability.htm.
19 Current Population Survey: Design and methodology (U.S. Department of Commerce, U.S. Census Bureau, 2006).
20 Labor Force Statistics from the Current Population Survey: Frequently asked questions about disability data (U.S. Bureau of Labor Statistics, 2009), on the Internet at http://www.bls.gov/cps/cpsdisability_faq.htm.
21 K. A. Clark and R. Hyson, "New tools for labor market analysis: JOLTS," Monthly Labor Review, December 2001, pp. 32–37.
22 Mining and logging; manufacturing (both durable and nondurable goods); wholesale trade; information; finance and insurance; and real estate and rental and leasing.
23 Professional and business services; educational services; health care and social assistance; accommodation and food services; Federal government; and state and local governments.
24 Construction; retail trade; transportation, warehousing, and utilities; arts, entertainment, and recreation; and "other services" such as automotive repair, religious organizations, beauty salons, private households, and civic, social, and advocacy organizations. Although beyond the scope of the JOLTS data, agriculture is also included in this category.
25 The O*NET Content Model: Detailed outline with descriptions (National Center for O*NET Development, 2007).
26 Employment and Earnings (U.S. Bureau of Labor Statistics, October 2009), "Table 1–D. Parameters and factors for computation of approximate standard errors," pp. 208–09. The appropriateness of using the formulas for analyses of the disability population was tested by comparing formula-based standard errors obtained for the ASEC with standard errors obtained using replicate weights.
27 See, for example, John R. Taylor, An Introduction to Error Analysis: The study of uncertainties in physical measurement (Sausalito, CA: University Science Books, 1997).
28 Matthew Brault, Review of Changes to the Measurement of Disability in the 2008 American Community Survey (U.S. Department of Commerce, U.S. Census Bureau, 2009).
29 P.F. Adams, K.M. Heyman and J.L. Vickerie, "Summary Health Statistics for the U.S. Population: National Health Interview Survey, 2008," Vital Health Statistics, 2009.
30 Matthew Brault, Americans with Disabilities: 2005 (U.S. Department of Commerce, U.S. Census Bureau, 2008). Age range is 21–64.
31 See, for example, Brault, Americans with Disabilities: 2005.
32 Benefits awarded—time series for selected benefit type (Social Security Administration, 2010), on the Internet at http://www.ssa.gov/OACT/ProgData/awards.html.
33 J. Bound and T. Waidmann, "Accounting for recent declines in employment rates among working-aged men and women with disabilities," Journal of Human Resources, Spring 2002, pp. 231–50.
Labor Force Statistics from the Current Population Survey
Employment rate of people with disabilities, The.—Nov. 2008.
Disability and the characteristics of employment—May 2003.
Within Monthly Labor Review Online:
Welcome | Current Issue | Index | Subscribe | Archives
Exit Monthly Labor Review Online:
BLS Home | Publications & Research Papers