News Release Information
12-115-PHI
Monday, January 23, 2012
Contacts
Technical information:
- (215) 597-3282
- BLSInfoPhiladelphia@bls.gov
- www.bls.gov/ro3
Media contact:
- (215) 861-5600
- BLSMediaPhiladelphia@bls.gov
County Employment and Wages in the District of Columbia – Second Quarter 2011
Local Wages Rose more Slowly than those for the Nation
The average weekly wage in Washington, D.C., rose 2.4 percent from the second quarter of 2010 to the second quarter of 2011, the U.S. Bureau of Labor Statistics reported today. Nationally, the average weekly wage rose 3.0 percent over the year, as 307 of the largest 322 counties had 12-month increases. (Large counties are defined as those with employment of 75,000 or more as measured by 2010 annual average employment.) Its over-the-year weekly wage growth placed Washington, D.C., 181st among the nation’s 322 large counties. Sheila Watkins, the Bureau’s regional commissioner, noted that the average weekly wage in Washington, D.C., ranked fourth-highest in the nation in the second quarter of 2011, at $1,541. Nationally, weekly wages averaged $891.
Washington, D.C., reported a 1.4-percent increase in employment from June 2010 to June 2011. Nationally, employment rose 0.9 percent during this 12-month period as 215 of the largest 322 U.S. counties gained jobs. Washington, D.C.’s percent growth in employment ranked 90th, placing it in the top third among the nation’s 322 largest counties. Employment in Washington, D.C., totaled 711,300 in June 2011.
Large county wage changes
Among the 322 largest counties, Williamson, Texas, had the largest over-the-year increase in average weekly wages (18.0 percent), followed by the counties of Middlesex, Mass. (10.2 percent), Harford, Md. (8.8 percent), Santa Clara, Calif. (8.5 percent), and Butler, Pa. (7.5 percent).
Champaign, Ill., led the nation in average weekly wage decline with a loss of 3.6 percent over the year. Benton, Ark. (-2.7 percent), had the second-largest overall decline among the counties, followed by Rutherford, Tenn. (-2.2 percent), New York, N.Y. (-1.1 percent), and Elkhart, Ind. (-1.0 percent).
Large county average weekly wages
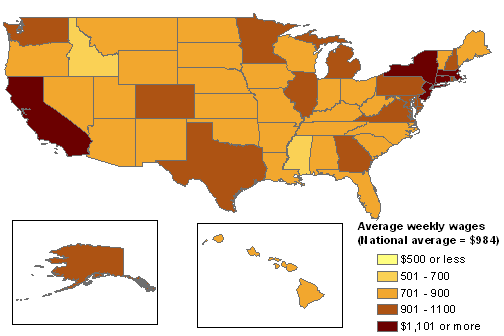
Across the United States, average weekly wages were higher than the national average in 107 of the largest 322 counties. Santa Clara, Calif., held the top position among the highest-paid large counties with an average weekly wage of $1,743. New York, N.Y., was second with an average weekly wage of $1,645, followed by Arlington, Va. ($1,553), Washington, D.C. ($1,541), and Fairfield, Conn. ($1,469).
Three of the 10 counties with the highest wages in the United States were located in the Washington metropolitan area (Arlington, Va.; Washington, D.C.; and Fairfax, Va.), and two others in the New York metropolitan area (New York, N.Y., and Fairfield, Conn.). Another three top-paying counties were located in or around the San Francisco metropolitan area (Santa Clara, San Francisco, and San Mateo, Calif.). Rounding out the top 10 were Middlesex and Suffolk, Mass., which were located in or around the Boston metropolitan area. (See table 1.)
There were 215 counties with an average weekly wage below the national average in the second quarter of 2011. The lowest average weekly wage was reported in Horry, S.C. ($526), followed by the counties of Hidalgo, Texas ($571), Cameron, Texas ($572), Yakima, Wash. ($610), and Webb, Texas ($616).
Additional statistics and other information
An annual bulletin, Employment and Wages Annual Averages Online, features comprehensive information by detailed industry on establishments, employment, and wages for the nation and all states. The 2010 edition of this bulletin, which was published in November 2011, contains selected data produced by Business Employment Dynamics (BED) on job gains and losses, as well as selected data from the first quarter 2011 version of the national news release. Tables and additional content from the 2010 Employment and Wages Annual Bulletin are now available online at www.bls.gov/cew/cewbultn10.htm. The 2011 edition of Employment and Wages Annual Averages online will be available later in 2012.
Information in this release will be made available to sensory impaired individuals upon request. Voice phone: 202-691-5200; TDD message referral phone number: 1-800-877-8339.
For personal assistance or further information on the Quarterly Census of Employment and Wages data, as well as other Bureau data, contact the Mid-Atlantic Information Office at 215-597-3282 from 8:30 a.m. to 12:00 p.m. and 1:00 p.m. to 3:30 p.m. ET.
Technical Note
QCEW data for states have been included in this release in table 2. For additional information about quarterly employment and wages data, please read the Technical Note or visit the QCEW Web site at www.bls.gov/cew/.
Average weekly wage data by county are compiled under the Quarterly Census of Employment and Wages (QCEW) program, also known as the ES-202 program. The data are derived from reports submitted by employers subject to state and federal unemployment insurance (UI) laws. The 9.1 million employer reports cover 130.5 million full- and part-time workers. The average weekly wage values are calculated by dividing quarterly total wages by the average of the three monthly employment levels of those covered by UI programs; this result is then divided by 13, the number of weeks in a quarter. It is to be noted, therefore, that over-the-year wage changes for geographic areas may reflect shifts in the composition of employment by industry, occupation, and such other factors as hours of work. Thus, wages may vary among counties, metropolitan areas, or states for reasons other than changes in the average wage. Data for all states, Metropolitan Statistical Areas (MSAs), counties, and the nation are available on the BLS Web site at www.bls.gov/cew/; however, data in QCEW press releases have been revised (see Technical Note below) and may not match the data contained on the Bureau’s Web site.
QCEW data are not designed as a time series. QCEW data are simply the sums of individual establishment records reflecting the number of establishments that exist in a county or industry at a point in time. Establishments can move in or out of a county or industry for a number of reasons--some reflecting economic events, others reflecting administrative changes.
The preliminary QCEW data presented in this release may differ from data released by the individual states as well as from the data presented on the BLS Web site. These potential differences result from the states’ continuing receipt, review and editing of UI data over time. On the other hand, differences between data in this release and the data found on the BLS Web site are the result of adjustments made to improve over-the-year comparisons. Specifically, these adjustments account for administrative (noneconomic) changes such as a correction to a previously reported location or industry classification. Adjusting for these administrative changes allows users to more accurately assess changes of an economic nature (such as a firm moving from one county to another or changing its primary economic activity) over a 12-month period. Currently, adjusted data are available only from BLS press releases.
| Area(3) | Employment | Average weekly wage(4) | ||||
|---|---|---|---|---|---|---|
| June 2011 (thousands) | Percent change, June 2010-11(5) | Average weekly wage | Ranking by level | Percent change, second quarter 2010-11(5) | Ranking by percent change | |
United States(6) |
130,469.9 | 0.9 | $891 | -- | 3.0 | -- |
Santa Clara, Calif. |
869.1 | 2.3 | 1,743 | 1 | 8.5 | 4 |
New York, N.Y. |
2,334.1 | 1.9 | 1,645 | 2 | -1.1 | 316 |
Arlington, Va. |
169.7 | 2.2 | 1,553 | 3 | 4.4 | 47 |
Washington, D.C. |
711.3 | 1.4 | 1,541 | 4 | 2.4 | 181 |
Fairfield, Conn. |
406.3 | 0.7 | 1,469 | 5 | 5.5 | 17 |
San Francisco, Calif. |
556.9 | 2.7 | 1,435 | 6 | 5.8 | 9 |
Fairfax, Va. |
585.2 | 1.3 | 1,421 | 7 | 2.2 | 196 |
San Mateo, Calif. |
325.0 | 1.0 | 1,403 | 8 | 6.1 | 8 |
Middlesex, Mass. |
814.7 | 0.4 | 1,385 | 9 | 10.2 | 2 |
Suffolk, Mass. |
585.2 | 1.8 | 1,382 | 10 | 3.7 | 80 |
|
Footnotes: |
||||||
| State | Employment | Average weekly wage(3) | ||||
|---|---|---|---|---|---|---|
| June 2010 (thousands) | Percent change, June 2009-10 | Average weekly wage | National ranking by level | Percent change, second quarter 2009-10 | National ranking by percent change | |
United States(4) |
130,469.9 | 0.9 | 891 | -- | 3.0 | -- |
Alabama |
1,824.8 | -0.4 | 767 | 34 | 2.3 | 41 |
Alaska |
335.9 | 1.6 | 941 | 9 | 2.6 | 27 |
Arizona |
2,336.3 | 1.1 | 842 | 20 | 2.7 | 26 |
Arkansas |
1,140.4 | -1.3 | 703 | 47 | 2.6 | 27 |
California |
14,664.6 | 0.3 | 1,019 | 6 | 4.0 | 7 |
Colorado |
2,234.7 | 1.4 | 900 | 13 | 3.4 | 16 |
Connecticut |
1,630.2 | 0.8 | 1,116 | 3 | 3.8 | 9 |
Delaware |
408.4 | 0.5 | 926 | 12 | 5.9 | 2 |
District of Columbia |
711.3 | 1.4 | 1,541 | 1 | 2.4 | 36 |
Florida |
7,092.3 | 0.8 | 802 | 25 | 2.6 | 27 |
Georgia |
3,803.1 | 1.0 | 832 | 21 | 2.5 | 32 |
Hawaii |
590.5 | 0.7 | 799 | 26 | 2.4 | 36 |
Idaho |
616.6 | 0.0 | 667 | 49 | 2.3 | 41 |
Illinois |
5,633.0 | 1.0 | 939 | 10 | 3.2 | 17 |
Indiana |
2,769.2 | 1.3 | 749 | 41 | 2.2 | 46 |
Iowa |
1,476.9 | 0.7 | 726 | 43 | 2.5 | 32 |
Kansas |
1,313.2 | -0.1 | 754 | 40 | 2.9 | 23 |
Kentucky |
1,751.8 | 0.9 | 760 | 38 | 2.3 | 41 |
Louisiana |
1,844.3 | -0.1 | 794 | 28 | 3.1 | 18 |
Maine |
593.8 | 0.3 | 712 | 46 | 1.9 | 48 |
Maryland |
2,513.5 | 0.5 | 987 | 7 | 3.1 | 18 |
Massachusetts |
3,230.4 | 0.9 | 1,120 | 2 | 5.6 | 3 |
Michigan |
3,896.9 | 1.8 | 845 | 19 | 2.4 | 36 |
Minnesota |
2,645.4 | 1.4 | 898 | 15 | 3.5 | 12 |
Mississippi |
1,079.4 | -0.6 | 664 | 50 | 1.8 | 49 |
Missouri |
2,617.7 | 0.3 | 774 | 31 | 1.6 | 50 |
Montana |
434.1 | 0.5 | 681 | 48 | 3.5 | 12 |
Nebraska |
911.6 | 0.1 | 714 | 45 | 2.4 | 36 |
Nevada |
1,123.0 | 0.5 | 816 | 24 | 2.5 | 32 |
New Hampshire |
615.2 | 0.4 | 888 | 16 | 2.4 | 36 |
New Jersey |
3,836.2 | -0.3 | 1,056 | 5 | 2.6 | 27 |
New Mexico |
788.7 | -0.5 | 763 | 37 | 2.8 | 24 |
New York |
8,575.3 | 1.0 | 1,092 | 4 | 1.0 | 51 |
North Carolina |
3,865.9 | 1.5 | 783 | 30 | 2.5 | 32 |
North Dakota |
382.4 | 5.1 | 769 | 33 | 8.2 | 1 |
Ohio |
5,009.1 | 0.9 | 795 | 27 | 2.6 | 27 |
Oklahoma |
1,510.3 | 0.7 | 749 | 41 | 4.5 | 5 |
Oregon |
1,637.5 | 0.7 | 819 | 22 | 4.2 | 6 |
Pennsylvania |
5,606.5 | 1.0 | 875 | 17 | 3.1 | 18 |
Rhode Island |
458.1 | 0.3 | 862 | 18 | 3.5 | 12 |
South Carolina |
1,801.6 | 1.1 | 726 | 43 | 2.3 | 41 |
South Dakota |
404.8 | 0.8 | 656 | 51 | 3.8 | 9 |
Tennessee |
2,616.9 | 1.3 | 794 | 28 | 2.3 | 41 |
Texas |
10,462.4 | 2.1 | 900 | 13 | 4.0 | 7 |
Utah |
1,183.9 | 2.0 | 756 | 39 | 3.1 | 18 |
Vermont |
297.0 | 1.0 | 773 | 32 | 2.8 | 24 |
Virginia |
3,619.7 | 0.9 | 949 | 8 | 2.2 | 46 |
Washington |
2,875.8 | 0.6 | 928 | 11 | 3.5 | 12 |
West Virginia |
702.9 | 0.3 | 765 | 36 | 5.4 | 4 |
Wisconsin |
2,712.0 | 0.9 | 767 | 34 | 3.0 | 22 |
Wyoming |
284.7 | 1.2 | 819 | 22 | 3.7 | 11 |
Puerto Rico |
915.1 | -1.4 | 496 | (5) | 0.6 | (5) |
Virgin Islands |
44.1 | 0.6 | 747 | (5) | 5.5 | (5) |
|
Footnotes: |
||||||
Data are preliminary.
Last Modified Date: January 23, 2012