‹ Countries
Panama
Panama

Country Analysis Note
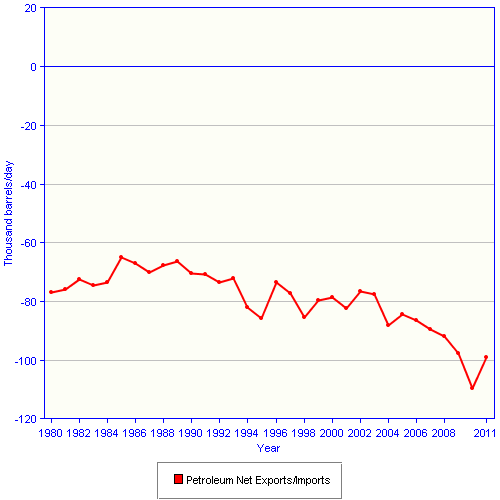
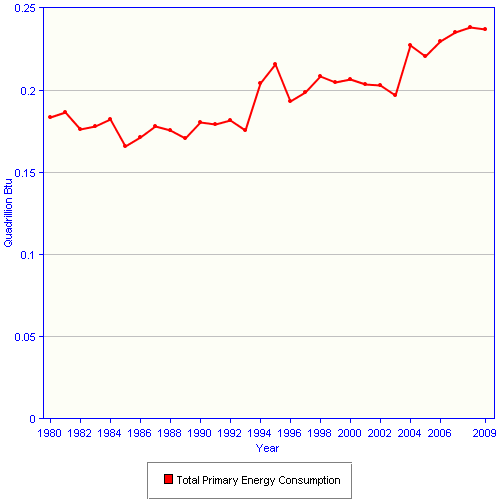
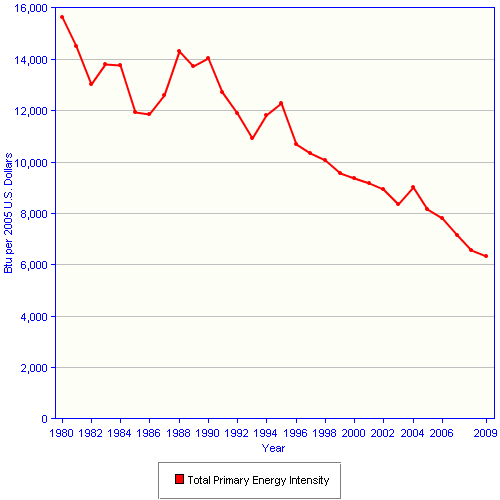
- Panama is not a large producer or consumer of energy, but merits attention as an energy transit point due to its control over the Panama Canal and Trans-Panama Pipeline.
- Refined petroleum products, all of which are imported, account for over 80 percent of Panama's energy consumption. The United States is the leading source of Panama's oil imports.
- Hydroelectric power accounted for almost 60 percent of Panama's electricity generation in 2010, with most of the remainder attributable to oil-fired thermoelectric plants. Panama is involved in two initiatives to integrate regional electricity grids: SIEPAC, which is an ambitious project to connect the transmission networks of six Central American countries, and a separate bilateral effort to build a power line that would link Panama with Colombia.
- The Panama Canal is an important trade route connecting the Pacific Ocean with the Caribbean Sea and Atlantic Ocean, but its relevance to the global oil trade has diminished because of changing trade patterns and the fact that many modern tankers are too large to travel through it. According to the Panama Canal Authority, 755,000 bbl/d of crude and petroleum products were transported through the canal in Fiscal Year 2011, of which 637,000 barrels per day (bbl/d) were refined products, and the rest crude oil. In order to make the canal more accessible to larger tankers, the Panama Canal Authority began an expansion program that it expects to complete by the end of 2014.
- The Trans-Panama Pipeline (TPP) or Transisthmian Pipeline, which is situated near the Costa Rican border, is another oil transit route that reduces transportation times and costs between the Atlantic and Pacific basins. It was originally constructed to facilitate crude oil shipments from Alaska to refineries on the U.S. Gulf Coast, but was recently reversed to carry crude oil from the Caribbean coast to the Pacific. An analysis of tanker data suggests that 100,000-150,000 bbl/d of crude oil, most of which is of Colombian and Angolan origin, currently flows through the pipeline.
Analysis Last Updated: February 2013
Overview data for Panama
+ EXPAND ALL


-- = Not applicable; NA = Not available; F = Forecast value
Sources: EIA. For more detailed data, see International Energy Statistics.
Data last updated: February 12, 2013
Other briefs related to Panama
Related International Information
International Energy Statistics
International Energy Outlook yearly energy projections through 2035
Short Term Energy Outlook monthly energy projections through 2014
Annual Energy Outlook yearly US energy projections through 2040
Sign Up for Email Updates