Maps and Data
Find maps and charts showing transportation data and trends related to alternative fuels and vehicles.
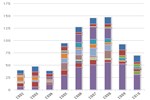
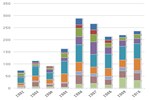
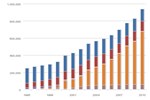
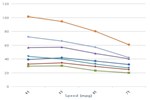
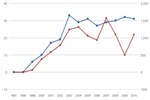
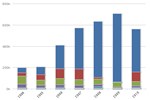
Estimated Consumption of Alternative Fuels by AFVs
| 1995 | 1996 | 1997 | 1998 | 1999 | 2000 | 2001 | 2002 | 2003 | 2004 | 2005 | 2006 | 2007 | 2008 | 2009 | 2010 | |
| Liquefied Petroleum Gas (LPG) | 233.178 | 239.648 | 238.845 | 241.881 | 210.247 | 213.012 | 216.319 | 223.6 | 224.697 | 211.883 | 188.171 | 173.13 | 152.36 | 147.784 | 129.631 | 126.354 |
| Compressed Natural Gas (CNG) | 35.865 | 47.861 | 66.495 | 73.859 | 81.211 | 88.478 | 106.584 | 123.081 | 133.222 | 158.903 | 166.878 | 172.011 | 178.565 | 189.358 | 199.513 | 210.007 |
| Liquefied Natural Gas (LNG) | 2.821 | 3.32 | 3.798 | 5.463 | 5.959 | 7.423 | 9.122 | 9.593 | 13.503 | 20.888 | 22.409 | 23.474 | 24.594 | 25.554 | 25.652 | 26.072 |
| 85% Methanol (M85) | 2.122 | 1.862 | 1.63 | 1.271 | 1.126 | 0.614 | 0.461 | 0.354 | 0 | 0 | 0 | 0 | 0 | 0 | 0 | 0 |
| Neat Methanol (M100) | 2.255 | 0.364 | 0.364 | 0.471 | 0.469 | 0 | 0 | 0 | 0 | 0 | 0 | 0 | 0 | 0 | 0 | 0 |
| 85% Ethanol (E85) | 0.195 | 0.712 | 1.314 | 1.772 | 4.019 | 12.388 | 15.007 | 18.25 | 26.376 | 31.581 | 38.074 | 44.041 | 54.091 | 62.464 | 71.213 | 90.323 |
| 95% Ethanol (E95) | 1.021 | 2.77 | 1.166 | 0.061 | 0.064 | 0.013 | 0 | 0 | 0 | 0 | 0 | 0 | 0 | 0 | 0 | 0 |
| Electric | 0.663 | 0.773 | 1.01 | 1.202 | 1.524 | 3.058 | 4.066 | 7.274 | 5.141 | 5.269 | 5.219 | 5.104 | 5.037 | 5.05 | 4.956 | 4.847 |
| Hydrogen | 0 | 0 | 0 | 0 | 0 | 0 | 0 | 0 | 0.002 | 0.008 | 0.025 | 0.041 | 0.066 | 0.117 | 0.14 | 0.152 |
Source: EIA Annual Energy Review 2011, Table 10.4 from the U.S. Energy Information Administration
Notes: Fuel volumes are expressed in gasoline gallon-equivalents (GGEs), representing a volume of fuel with the same energy content as a gallon of gasoline.
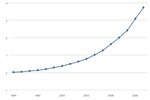
This chart shows trends in alternative fuel consumption in alternative fuel vehicles, by fuel type, from 1995 to 2010. Compressed natural gas (CNG) consumption has increased steadily since 1995, owing largely to state and federal government incentives, increased natural gas supply, and falling natural gas prices. Use of propane, on the other hand, which was once the most common alternative vehicle fuel, has trended downward as CNG has become more popular. E85 use has been growing as the availability of flex fuel vehicles from major manufacturers has increased, and as an increasing number of fueling stations offer E85.