Maps and Data
Find maps and charts showing transportation data and trends related to alternative fuels and vehicles.
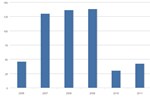
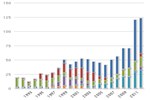
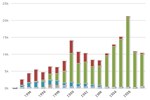
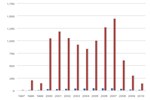
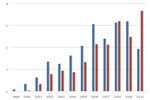
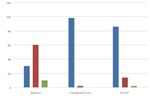
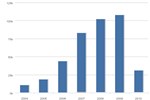
Clean Cities Hybrid Electric Vehicle Inventory
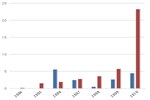
| 2004 | 2005 | 2006 | 2007 | 2008 | 2009 | 2010 | |
| HEVs | 10674 | 18553 | 43886 | 81987 | 101954 | 107585 | 30613 |
| PHEVs | 0 | 114 | 105 | 896 | 374 | 78 | 397 |
Source: Clean Cities annual metrics reports, 2004-2010.
Notes: This chart shows the number of hybrid electric vehicles (HEVs) and plug-in HEVs (PHEVs) on the road in a given year, deployed with help from Clean Cities.
This chart shows the number of hybrid electric vehicles (HEVs) and plug-in HEVs (PHEVs) on the road in a given year, deployed with help from Clean Cities.