Maps and Data
Find maps and charts showing transportation data and trends related to alternative fuels and vehicles.
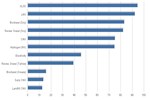
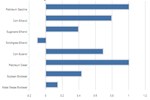
U.S. Life Cycle Greenhouse Gas Emissions of Biofuels
| Petroleum Gasoline | Corn Ethanol | Sugarcane Ethanol | Switchgrass Ethanol | Corn Butanol | Petroleum Diesel | Soybean Biodiesel | Waste Grease Biodiesel | |
| Percent of Petroleum GHG Emissions | 100 | 79 | 39 | -10 | 69 | 100 | 43 | 14.000000000000002 |
Source: Environmental Protection Agency (EPA) Renewable Fuel Standard Program (RFS2) Regulatory Impact Analysis
Notes: Emissions data is based on analysis by the U.S. Environmental Protection Agency, for the Renewable Fuel Standard Program (RFS2).
This chart compares life cycle greenhouse gas (GHG) emissions of various biofuels with those of petroleum fuels they replace, as assessed by the U.S. Environmental Protection Agency. The GHG emissions benefit of ethanol varies according to the feedstock used to produce it, with the greatest benefit achieved by ethanol produced from switchgrass. The negative emissions of switchgrass indicate a net sequestration of carbon into the soil and biomass. Life cycle emissions levels of biodiesel also vary according to feedstock, with biodiesel produced from waste grease resulting in a greater GHG emissions benefit than emissions from biodiesel produced from soybean biodiesel.