Maps and Data
Find maps and charts showing transportation data and trends related to alternative fuels and vehicles.
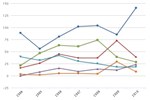
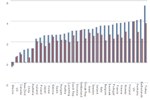
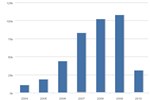
On-Road AFVs Made Available by Year
| 1998 | 1999 | 2000 | 2001 | 2002 | 2003 | 2004 | 2005 | 2006 | 2007 | 2008 | 2009 | 2010 | |
| E85 Flex Fuel Vehicle | 216.165 | 426.724 | 600.832 | 581.774 | 834.976 | 859.261 | 674.678 | 743.948 | 1011.399 | 1115.069 | 1175.345 | 805.777 | 1484.945 |
| Compressed Natural Gas (CNG) | 10.221 | 13.425 | 9.501 | 11.121 | 8.988 | 6.122 | 7.752 | 3.304 | 3.128 | 2.487 | 4.44 | 3.77 | 4.973 |
| Electric | 1.844 | 1.957 | 6.215 | 6.682 | 15.484 | 12.395 | 2.2 | 2.281 | 2.715 | 3.152 | 2.802 | 2.255 | 2.229 |
| Liquefied Petroleum Gas (LPG) | 5.62 | 5.955 | 4.435 | 3.201 | 1.667 | 2.111 | 2.15 | 0.7 | 0.473 | 0.356 | 0.695 | 0.861 | 0.747 |
| Liquefied Natural Gas (LNG) | 0.38 | 0.04 | 0.411 | 0.393 | 0.147 | 0.111 | 0.136 | 0.068 | 0.092 | 0.026 | 0.384 | 0.126 | 0.231 |
| Hydrogen | 0 | 0 | 0 | 0 | 0.002 | 0.006 | 0.031 | 0.074 | 0.04 | 0.063 | 0.063 | 0.026 | 0.064 |
Source: Energy Information Administration, Alternatives to Traditional Transportation Fuels 1998-2010 reports.
This chart shows the number of on-road alternative fuel vehicles (AFVs) that were sold, leased, or converted in the United States between 1998 and 2009. Flex-fuel vehicles, which are capable of running on E85, plain gasoline, or any ethanol-gasoline blends in between, represent the vast majority of AFVs made available in the market. This is due to their ability to use readily available gasoline and to federal regulations that require vehicle manufacturers to produce vehicles capable of running on non-petroleum based fuels. The peak in 2008 coincides with the oil price spike of that year. For comparison, see Light-Duty Vehicles Sold in the U.S.