Table of Contents
NOTE: The terms Coordinated Universal Time (UTC) and Zulu
(Z) are equivalent. Maps
of coastal & offshore waters courtesy of NWS
headquarters.
Surface Analysis with Satellite overlay
Description of Surface Analysis
Charts
Atlantic
|
Surface Analysis
|
West |
East |
Last Updated |
| 00Z |
GIF |
GIF |
Thursday, 14-Feb-2013 02:57:15 UTC |
| 06Z |
GIF |
GIF |
Wednesday, 13-Feb-2013 08:54:52 UTC |
| 12Z |
GIF |
GIF |
Wednesday, 13-Feb-2013 14:54:31 UTC
|
| 18Z |
GIF |
GIF |
Wednesday, 13-Feb-2013 21:05:19 UTC |
Pacific
| Surface Analysis |
West |
East |
Last Updated |
| 00Z |
GIF |
GIF |
Thursday, 14-Feb-2013 02:54:57 UTC |
| 06Z |
GIF |
GIF |
Wednesday, 13-Feb-2013 08:51:59 UTC
|
| 12Z |
GIF |
GIF |
Wednesday, 13-Feb-2013 15:07:23 UTC |
| 18Z |
GIF |
GIF |
Wednesday, 13-Feb-2013 21:04:58 UTC |
NOTICE: The following
links below are external to the Ocean Prediction Center and we are
unable to answer questions about the images. You are referred to
the NESDIS Satellite Services
Division (NOAA) for questions or comments on the images listed
below for the Atlantic, Gulf of Mexico, and the Pacific
regions.
GOES Hurricane Sectors For
Atlantic & Pacific
-
Visible - Loop -
Infrared -
Water Vapor
-
Visible - Loop -
Infrared -
Water Vapor
Atlantic
and Gulf of Mexico
GOES
East (Every
hour)
East Coast
Northwest Atlantic
Sector
Western Atlantic and Caribbean
Sector
Gulf of Mexico Sector
Additional
Imagery
Atlantic and Gulf of Mexico
Tropical
METEOSAT (Every 6 hours)
Eastern Atlantic
Sector
Northeastern Atlantic
Sector
Pacific
GOES
East (Every
Hour)
North East Pacific
Sector
East Pacific
Sector
GOES West
(Every
Hour)
Central Pacific
Sector
West Central Pacific
Sector
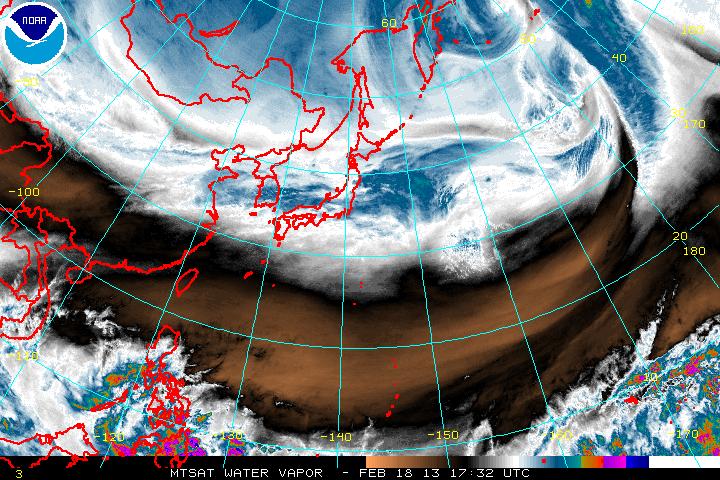
MTSAT (Every Hour)
Northwest Pacific Sector
Additional
Imagery
Pacific Tropical


