
 Greenhouse Gas Index
 Ozone Depletion Index
 Trends in CO2
 CarbonTracker
 GLOBALVIEW
 Observatory Operations
 Barrow, Alaska
 Trinidad Head, California
 Mauna Loa, Hawaii
 American Samoa
 South Pole
 Summit, Greenland
 Seminars
- Recent Monthly CO2 at Mauna Loa
- Full Mauna Loa CO2 Record
- Annual Mean CO2 Growth Rate at Mauna Loa
- Mauna Loa CO2 Data
Recent Mauna Loa CO2
January 2012: 393.14 ppm
 PDF Version
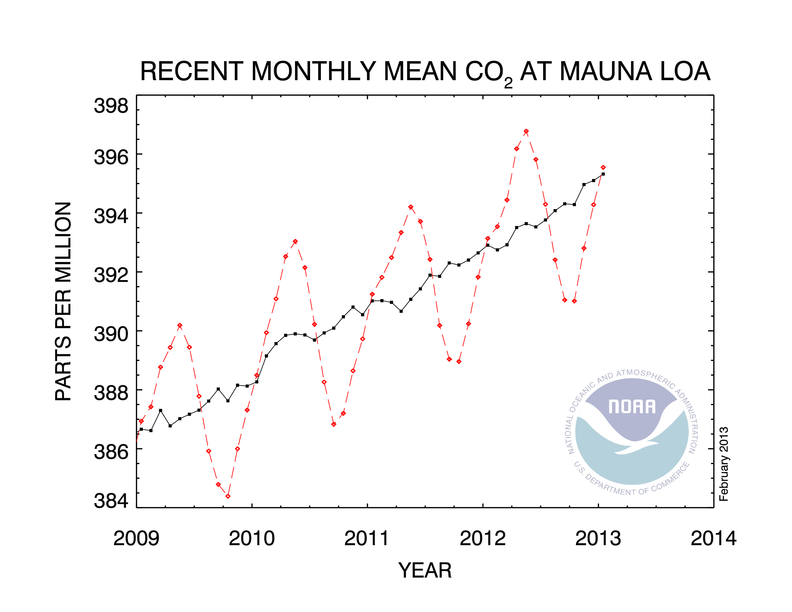
The graph shows recent monthly mean carbon dioxide measured at Mauna Loa Observatory, Hawaii.
The last four complete years of the Mauna Loa CO2 record plus the current year are shown. Data are reported as a dry air mole fraction defined as the number of molecules of carbon dioxide divided by the number of all molecules in air, including CO2 itself, after water vapor has been removed. The mole fraction is expressed as parts per million (ppm). Example: 0.000400 is expressed as 400 ppm.
In the above figure, the dashed red line with diamond symbols represents the monthly mean values, centered on the middle of each month. The black line with the square symbols represents the same, after correction for the average seasonal cycle. The latter is determined as a moving average of SEVEN adjacent seasonal cycles centered on the month to be corrected, except for the first and last THREE and one-half years of the record, where the seasonal cycle has been averaged over the first and last SEVEN years, respectively.
The last year of data are still preliminary, pending recalibrations of reference gases and other quality control checks. The Mauna Loa data are being obtained at an altitude of 3400 m in the northern subtropics, and may not be the same as the globally averaged CO2 concentration at the surface.
Full Mauna Loa CO2 record
 PDF Version
Monthly mean atmospheric carbon dioxide at Mauna Loa Observatory, Hawaii
The carbon dioxide data (red curve), measured as the mole fraction in dry air, on Mauna Loa constitute the longest record of direct measurements of CO2 in the atmosphere. They were started by C. David Keeling of the Scripps Institution of Oceanography in March of 1958 at a facility of the National Oceanic and Atmospheric Administration [Keeling, 1976]. NOAA started its own CO2 measurements in May of 1974, and they have run in parallel with those made by Scripps since then [Thoning, 1989]. The black curve represents the seasonally corrected data.
Data are reported as a dry mole fraction defined as the number of molecules of carbon dioxide divided by the number of molecules of dry air multiplied by one million (ppm).
Annual Mean Growth Rate for Mauna Loa, Hawaii
 PDF Version
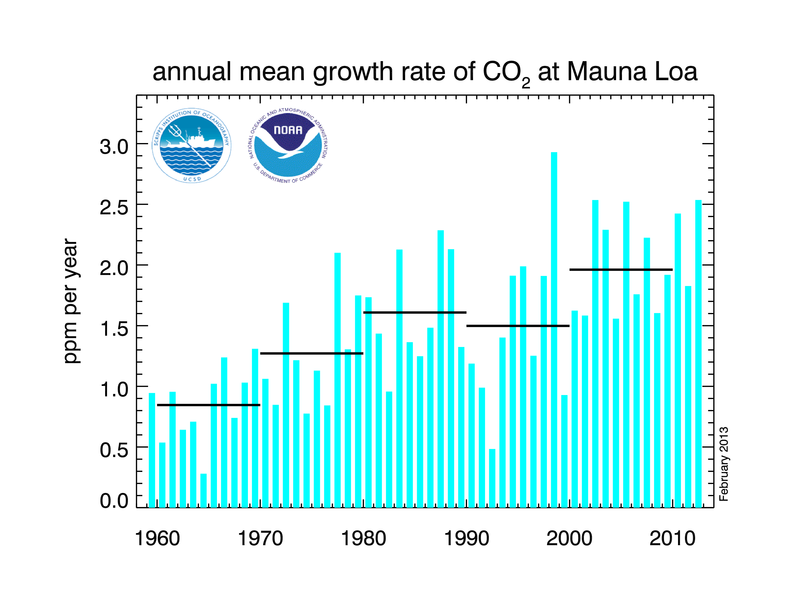
The table and the graph show annual mean carbon dioxide growth rates for Mauna Loa. In the graph, also decadal averages of the growth rate are plotted, as horizontal lines for 1960 through 1969, 1970 through 1979, and so on.
The annual mean rate of growth of CO2 in a given year is the difference in concentration between the end of December and the start of January of that year. If used as an average for the globe, it would represent the sum of all CO2 added to, and removed from, the atmosphere during the year by human activities and by natural processes. There is a small amount of month-to-month variability in the CO2 concentration that may be caused by anomalies of the winds or weather systems arriving at Mauna Loa. This variability would not be representative of the underlying trend for the northern hemisphere which Mauna Loa is intended to represent. Therefore, we finalize our estimate for the annual mean growth rate of the previous year in March, by using the average of the most recent November-February months, corrected for the average seasonal cycle, as the trend value for January 1. Our estimate for the annual mean growth rate (based on the Mauna Loa data) is obtained by subtracting the same four-month average centered on the previous January 1. Preliminary values for the previous year are calculated in January and in February.
The estimated uncertainty in the Mauna Loa annual mean growth rate is 0.11 ppm/yr. This estimate is based on the standard deviation of the differences between monthly mean values measured independently by the Scripps Institution of Oceanography and by NOAA/ESRL. The annual growth rate measured at Mauna is not the same as the global growth rate, but it is quite similar. One standard deviation of the annual differences MLO minus global is 0.26 ppm/year.
Data
The complete Mauna Loa CO2 records described on this page are available.
 Mauna Loa CO2 monthly mean data
- Mauna Loa CO2 annual mean data
- Mauna Loa CO2 annual mean growth rates
Additional CO2 data from Mauna Loa and other worldwide sampling sites can be found using the ESRL/GMD Data Navigator of public data sets.
These values are subject to change depending on quality control checks of the measured data, but any revisions are expected to be small.
How to reference content from this page
Dr. Pieter Tans, NOAA/ESRL (www.esrl.noaa.gov/gmd/ccgg/trends/) and Dr. Ralph Keeling, Scripps Institution of Oceanography (scrippsco2.ucsd.edu/).
Contact
- Pieter Tans, NOAA/ESRL, ph. 303 497 6678, Pieter.Tans@noaa.gov
Further Reading
- C.D. Keeling, R.B. Bacastow, A.E. Bainbridge, C.A. Ekdahl, P.R. Guenther, and L.S. Waterman, (1976), Atmospheric carbon dioxide variations at Mauna Loa Observatory, Hawaii, Tellus, vol. 28, 538-551
- K.W. Thoning, P.P. Tans, and W.D. Komhyr, (1989), Atmospheric carbon dioxide at Mauna Loa Observatory 2. Analysis of the NOAA GMCC data, 1974-1985, J. Geophys. Research, vol. 94, 8549-8565