- News
- Overview
- Assessments
- Data
News
 |
The Amerasia Basin Petroleum Province encompasses the Canada Basin and the sediment prisms along the Alaska and Canada margins, outboard from basinward margins (hingelines) of the rift shoulders that formed during extensional opening of the Canada Basin. The province includes... |
Friday, November 16, 2012 Type: Publication
|
 |
The Arctic Alaska Petroleum Province encompasses all lands and adjacent continental shelf areas north of the Brooks Range-Herald arch tectonic belts and south of the northern (outboard) margin of the Alaska rift shoulder. Even though only a small part is thoroughly explored, ... |
Friday, November 16, 2012 Type: Publication
|
 |
Using a geology-based assessment methodology, the U.S. Geological Survey estimated mean volumes of undiscovered conventional petroleum resources in six geologic provinces of China at 14.9 billion barrels of oil, 87.6 trillion cubic feet of natural gas, and 1.4 billion barrels of natural-gas liquids. |
Thursday, November 01, 2012 Type: Publication
|
 |
Using a geology-based assessment methodology, the U.S. Geological Survey estimated means of 86 billion barrels of oil and 336 trillion cubic feet of undiscovered natural gas resources in the Arabian Peninsula and Zagros Fold Belt. The USGS assessed the potential for undiscovered conventional... |
Tuesday, October 02, 2012 Type: Publication
|
 |
The Irrawaddy‒Andaman and Indo-Burman Geologic Provinces were recently assessed for undiscovered technically recoverable oil, natural gas, and natural gas liquids resources as part of the U.S. Geological Survey’s (USGS) World Oil and Gas Assessment. Using a geology-based assessment methodology... |
Tuesday, September 04, 2012 Type: Publication
|
 |
This report was first presented as an abstract in poster format at the American Association of Petroleum Geologists (AAPG) 2012 Annual Convention and Exhibition, April 22‒25, Long Beach, Calif., as Search and Discovery Article no. 90142.
Shale resource plays occur in predictable tectonic... |
Monday, August 13, 2012 Type: Publication
|
 |
The U.S. Geological Survey (USGS) periodically assesses petroleum resources of areas within the United States and the world. The purpose of this report is to explain the development of an analytic probabilistic method and spreadsheet software system called Analytic Cell-Based Continuous Energy... |
Thursday, August 09, 2012 Type: Publication
|
 |
Using a geology-based assessment methodology, the U.S. Geological Survey estimated means of 19 billion barrels of oil and 83 trillion cubic feet of undiscovered natural gas resources in 10 geologic provinces of Mexico, Guatemala, and Belize.
|
Friday, July 27, 2012 Type: Publication
|
 |
USGS estimated mean volumes of 1,345 billion cubic feet of potentially technically recoverable gas and 168 million barrels of technically recoverable oil and natural gas liquids in Ordovician and Silurian age shales in the Polish- Ukrainian Foredeep basin of Poland.
|
Wednesday, July 18, 2012 Type: Publication
|
 |
This report discusses the geologic framework and petroleum geology used to assess undiscovered petroleum resources in the Bohaiwan basin province for the 2000 World Energy Assessment Project of the U.S. Geological Survey. The Bohaiwan basin in northeastern China is the largest petroleum-producing... |
Friday, June 29, 2012 Type: Publication
|
Overview
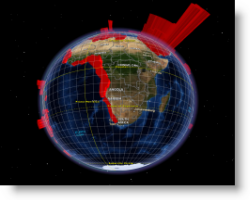
Relative Volumes of Asssessed
Undiscovered Gas Resources in 3D.
The USGS World Energy Project conducts geologic studies that provide an understanding of the quantity, quality, and geologic distribution of world oil and gas resources. Our geologic studies are conducted in an impartial manner and are performed in collaboration and partnership with energy experts within and outside government. Through synthesis and improved understanding of global oil and gas data, we shall establish a geologic basis for predicting energy production trends, we shall discuss logical implications and consequences of energy occurrence for public policy, and we shall provide for the education of society about energy issues.
Energy is critical to the health and vitality of U.S. and world societies. Historically, prosperity has been directly correlated with energy use. However, energy resources are unevenly distributed throughout the world, and exploration and development of those energy resources is risky. Some have argued that conflicting needs for sources of energy have been the principal causes for major world conflicts in the twentieth century. The World Energy Project provides geologic information and resource assessments which help reduce some of the risks and may directly impact public policy.
Credible scientific information on the abundance and geologic distribution of energy is critically needed for two ongoing national struggles. The first struggle has been for U.S. energy self sufficiency, particularly for petroleum. The U.S. is currently highly dependent upon other nations for the oil that constitutes approximately 50% of our energy use. The United States is an enormous producer of energy. We are currently the world's largest producer of oil, nuclear, and hydro power combined, and the second largest producer of natural gas and coal. However, the United States alone uses approximately one quarter of the world's supply of energy, but has only about 5% of the world’s population. As of early 2000, the U.S. consumes almost 12 million barrels daily more energy than we produce (in oil equivalent); the shortfall is made up by imported oil. Despite the most technologically advanced exploration and production systems in the world operating in a deregulated environment, U.S. oil and NGL reserves have decreased 30 percent from the high in 1970. The primary reason petroleum reserves have not fallen further is the technological advances in exploration and production that provide additional reserves through the phenomenon of reserve growth. According to the Energy Information Administration, over the past fifteen years an additional million barrels of oil per day has been required to meet world energy demands. Survival of the oil industry within the U.S. today is a story of increasing the life of old fields technologically or exploring in very expensive areas such as the deep Gulf of Mexico or the Arctic.
The second energy struggle is outside the U.S. This struggle is economic, political, and technological, and is waged on the field of uneven geologic distribution of energy resources. The ongoing struggle for energy has been manifested in a military conflict in the Middle East, political struggles in the Former Soviet Union, and financial struggles throughout the world. In order to maintain prosperity, the United States seeks to fill its growing demand for energy internationally. The risks in other energy-rich areas of the world are numerous. New political, financial, and technical risks are added to all the risks traditionally associated with exploration and production of energy. U.S. petroleum companies have increasingly chosen to take their risks internationally because they feel that the greater financial risk overseas is offset by the potential for greater financial rewards. The immense aggregate risks overseas compound the overall financial risk to the Nation of the increasing cost of importing oil. More dollars are spent on buying foreign oil than on buying foreign cars.
The USGS World Energy Project provides public information and analysis to companies, investors and policy makers alike. Basic information for petroleum resource assessment in foreign lands, if available, is difficult to obtain. In the past only large multinational companies have performed such surveys and then only for the benefit of the individual company. USGS products are available to the public; industry, private investors, and the government have already indicated considerable interest.
The essence of the argument for the study of petroleum resources worldwide was captured in the recent strategic plan for the USGS in the Year 2005, where it was determined that increasing emphasis on international mineral and energy studies will be matched by decreasing emphasis on domestic mineral and energy studies. Outside the USGS, as noted above, this change has already taken place. The USGS World Energy Project provides science-based, impartial, comprehensive information for decision makers, policy makers, and the scientific and industrial community to help ensure that the U.S. has a stable supply of energy for future economic and societal needs.
Christopher Schenk
Project Chief
Assessments
Updated International Assessments (Post 2000 Assessment)
The World Petroleum Assessment Team has recently been updating assessments conducted during the comprehensive 2000 assessment as well as conducting new ones in areas around the world that were not examined previously. This work is being conducted using the latest assessment methodologies for continuous resources. Many of these newly conducted assessments have been complete and are available here... [+]
- Oil and Gas Resources of the North Cuba Basin, Cuba (Fact Sheet 2005–3009)
- Petroleum Resources of the Barents Sea Shelf (Fact Sheet 2009–3037)
- Petroleum Resources of Southern and Western Afghanistan (Fact Sheet 2009–3070)
- Estimate of Recoverable Heavy Oil Resources of the Orinoco Oil Belt, Venezuela (Fact Sheet 2009–3028)
- Potential Shale Gas and Shale Oil Resources of the Norte Basin, Uruguay (Fact Sheet 2011–3100)
- Oil and Gas Resources of Four West Africa Geologic Provinces (Fact Sheet 2010–3006)
- Oil and Gas Resources of the West African Coastal Province, West Africa (Fact Sheet 2011–3034)
- Oil and Gas Resources of Four East Africa Geologic Provinces (Fact Sheet 2012-3039)
- Oil and Gas Resources of South Africa Coastal Province, Africa (Fact Sheet 2012-3030)
- Oil and Gas Resources of the Sud Province, North-Central Africa (Fact Sheet 2011–3029)
- Oil and Gas Resources of the Chad Basin Province, North-Central Africa (Fact Sheet 2010–3096)
- Oil and Gas Resources of the Red Sea Basin Province (Fact Sheet 2010–3119)
- Oil and Gas Resources of Libya and Tunisia (Fact Sheet 2011–3105)
- Oil and Gas Resources of the Nile Delta Basin Province, Eastern Mediterranean (Fact Sheet 2010–3027)
- Oil and Gas Resources of the Levant Basin Province, Eastern Mediterranean (Fact Sheet 2010–3014)
- Oil and Gas Resources of Southeast Asia (Fact Sheet 2010–3015)
- Oil and Gas Resources of the Volga-Ural Region Province, Russia and Kazakhstan (Fact Sheet 2010–3095)
- Oil and Gas Resources of the North Caspian Basin, Middle Caspian Basin, North Ustyurt Basin, and South Caspian Basin Provinces, Caspian Sea Area (Fact Sheet 2010–3094)
- Oil and Gas Resources of the North Sakhalin Basin Province, Russia (Fact Sheet 2011–3149)
- Oil and Gas Resources of the Dnieper–Donets Basin Province and Pripyat Basin Province, Russia, Ukraine, and Belarus (Fact Sheet 2011–3051)
- Oil and Gas Resources of the Azov–Kuban Basin Province, Ukraine and Russia (Fact Sheet 2011–3052)
- Oil and Gas Resources of the West Siberian Basin Province, Russia (Fact Sheet 2011–3050)
- Oil and Gas Resources of the Southern Siberian Craton (Baykit High, Nepa–Botuoba High, Angara−Lena Terrace, and Cis−Patom Foredeep Provinces), Russia (Fact Sheet 2011–3155)
- Potential Unconventional Carboniferous-Permian Gas Resources of the Liaohe Basin Eastern Uplift, Liaoning Province, China
- Potential Shale Gas Resources of the Bombay, Cauvery, and Krishna–Godavari Provinces, India (Fact Sheet 2011–3131)
- Oil and Gas Resources of the Amu Darya Basin and Afghan–Tajik Basin Provinces, Afghanistan, Iran, Tajikistan, Turkmenistan, and Uzbekistan (Fact Sheet 2011–3154)
- Oil and Gas Resources of Bonaparte Basin, Browse Basin, Northwest Shelf, and Gippsland Basin Provinces, Australia (Fact Sheet 2012–3025)
- Oil and Gas Resources of Papua New Guinea, Eastern Indonesia, and East Timor (Fact Sheet 2012–3029)
- Oil and Gas Resources of the Assam, Bombay, Cauvery, and Krishna–Godavari Provinces, South Asia (Fact Sheet 2012–3029)
- Conventional Oil and Gas Resources of South America and the Caribbean (Fact Sheet 2012–3046)
- Unconventional Gas and Oil Resources in the Polish-Ukrainian Foredeep, Poland (Fact Sheet 2012–3102)
- Conventional Oil and Gas Resources of Mexico, Guatemala, and Belize (Fact Sheet 2012–3069)
2008 Circum-Arctic Resource Appraisal
The U.S. Geological Survey (USGS) has completed an assessment of undiscovered conventional oil and gas resources in all areas north of the Arctic Circle. Using a geology based probabilistic methodology, the USGS estimated the occurrence of undiscovered oil and gas in 33 geologic provinces thought to be prospective for petroleum. The sum of the mean estimates for each province indicates that 90 billion barrels of oil, 1,669 trillion cubic feet of natural gas, and 44 billion barrels of natural gas liquids may remain to be found in the Arctic, of which approximately 84 percent is expected to occur in offshore areas.
Access this content here.
2000 World Petroleum Assessment
The USGS undertook this world petroleum assessment in order to provide impartial, scientifically based, societally relevant petroleum-resource information essential to the economic and strategic security of the United States. This assessment is based on extensive geologic studies as opposed to statistical analysis. A team of more than 40 geoscientists and additional supporting staff conducted the study over a five-year period from 1995 to 2000. The petroleum assessed occurs in fields exceeding a stated minimum size, which varies between 1 and 20 million barrels of oil equivalent in different areas, and in accumulation categories judged to be viable in a 30-year forecast span.
Access this content here.
Data
2000 World Assessment Data (DDS60)
These data files are from the fourth CD-ROM of a four CD-ROM set documenting and supporting the USGS World Petroleum Assessment 2000–Description and Results report. The fourth CD-ROM contains archival data and supporting software permitting the user to query databases and perform further analysis. Access to these data can be found here.
Spatial Data [+]
Spatial Data Files from World Petroleum Assessment 2000 (DDS 60)
|
| Dataset |
Shapefile |
Arc
Export |
Metadata |
| au_sum.e00 - Assessment Unit Summary Data (Robinson projection) |
|
Download |
View |
| au_sumg.e00 - Assessment Unit Summary Data (geographic coordinates) |
Download |
Download |
View |
| tps_geo.e00 - Total Petroleum System Geologic Characterizations (Robinson projection) |
|
Download |
View |
| tps_geog.e00 -Total Petroleum System Geologic Characterizations (geographic coordinates) |
Download |
Download |
View |
| tps_sum.e00 - Total Petroleum System Summary Data (Robinson projection) |
|
Download |
View |
| tps_sumg.e00 - Total Petroleum System Summary Data (geographic coordinates) |
Download |
Download |
View |
| wep_prv.e00 - Geologic Provinces of the World (Robinson projection) |
|
Download |
View |
| wep_prvg.e00 - Geologic Provinces of the World (geographic coordinates) |
Download |
Download |
View |
Assessment Tables [+]
|
Data Tables from World Petroleum Assessment 2000 (DDS 60)
|
|
The following files contain the supporting data for the World Petroleum Assessment and are the source for the various plots, data tables, and summary tables used in this report.
|
| auvol.tab - Table contains volumetric data of discovered petroleum in regions, provinces, total petroleum systems, and assessment units. These volumes are the sum of volumes of individual fields reported in Petroconsultants (1996) and NRG Associates (1995). |
| bin_au.tab - Table contains the field size distribution of undiscovered fields. Results are divided into binned field-size classes and reported at the assessment unit level. The class limits are in millions of barrels of oil equivalent (MMBOE), where 6000 cubic feet of gas equals one equivalent barrel. Each assessment unit is represented by two rows, one for oil fields and one for gas fields. |
| bin_prov.tab - Table contains the distribution of field sizes of undiscovered fields. Results are divided into binned field-size classes and reported at the province level. The class limits are in millions of barrels of oil equivalent (MMBOE), where 6000 cubic feet of gas equals one equivalent barrel. Each province is represented by two rows, oil fields and gas fields, respectively. |
| frac_au.tab - Table contains fractiles from the results of the Monte Carlo calculations. Results are reported at the assessment unit level. Each assessment unit is represented by seven rows (distinguished by the values of columns 3 and 4): oil in oil fields; gas in oil fields; natural gas liquids (NGL) in oil fields; the largest undiscovered oil field; gas in gas fields; liquids in gas fields; and the largest undiscovered gas field. |
| gdisc.tab - Table contains information regarding known and grown volumes of petroleum in an assessment unit. Grown field sizes are defined as known field sizes that were adjusted upward to account for estimated future reserve growth. These tables contain 54 columns. NA means not applicable and shown either in place of volumes for which only one field is present. |
| input.tab - Table contains input data from the Seventh Approximation World Petroleum Assessment Data Forms for Conventional Assessment Units used in this report. For some Canadian assessment units, pool data, rather than field data, are reported. Blank cells represent no data. This table contains 147 columns. |
| kdisc.tab - Table contains information regarding known and grown volumes of petroleum in an assessment unit. Grown field sizes are defined as known field sizes that were adjusted upward to account for estimated future reserve growth. These tables contain 54 columns. NA means not applicable and shown in place of volumes for which only one field is present. |
| master.tab - Table contains names and codes of the hierarchical structure of assessment units that were identified in World Petroleum Assessment 2000. The hierarchical structure includes USGS-regions, provinces, total petroleum systems, and assessment units. |
| provvol.tab - Table contains volumetric data of discovered petroleum in regions, provinces, total petroleum systems, and assessment units. These volumes are the sum of volumes of individual fields reported in Petroconsultants (1996) and NRG Associates (1995). These tables contains 31 columns. NA means not applicable and is shown either in place of discovered volumes for which only one field is present, or for undiscovered volumes and values calculated from these volumes in assessment units not quantitatively assessed. |
| regvol.tab - Table contains volumetric data of discovered petroleum in regions, provinces, total petroleum systems, and assessment units. These volumes are the sum of volumes of individual fields reported in Petroconsultants (1996) and NRG Associates (1995) database. These tables contains 31 columns. NA means not applicable and is shown either in place of discovered volumes for which only one field is present, or for undiscovered volumes and values calculated from these volumes in assessment units not quantitatively assessed. |
| sum_au.tab - Table contains summary results of the Monte Carlo calculations. Results are reported at the assessment unit level. Each assessment unit is represented by two rows, oil fields and gas fields, respectively. |
| sum_ca.tab - Table contains the Country allocation summary results from the Monte Carlo calculations. Results are reported at the parcel level. Each parcel is identified by the assessment unit being allocated (columns 3 and 4), the country to which the allocation is made (column 1), the onshore or offshore identification (column 2), and the field type (column 5). |
| sum_ct.tab - Table contains Country allocation totals from the summary results of the Monte Carlo calculations. Results are reported at the parcel level. Each parcel is identified by the country to which the allocation is made (column 1), the summation level (column 4), and the field type (column 5). The three summation levels are onshore total, offshore total, and (grand) total. For each summation level, there are two rows; oil fields and gas fields, respectively. The structure of the Country summary totals table, sum_ct.tab, is the same as the Country summary allocation table, sum_ca.tab, so that these files can be appended if desired. The only columns treated differently are columns 2, 3, and 4. |
| sum_ctry.tab - Table contains summary results of the Monte Carlo calculations. Results are reported at the Country level. Each Country is represented by two rows, oil fields and gas fields, respectively. |
| sum_pa.tab - Table contains province allocations from the summary results of the Monte Carlo calculations. Results are reported at the parcel level. Each parcel level is identified by the assessment unit being allocated (columns 4 and 5), the province to which the allocation is made (columns 1 and 2), the onshore or offshore identification (column 3), and the field type (column 6). |
| sum_prov.tab - Table contains summary results of the Monte Carlo calculations. Results are reported at the province level. Each province is represented by two rows, oil fields and gas fields, respectively. |
| sum_pt.tab - Table contains the province allocation totals from the summary of results of the Monte Carlo calculations. Results are reported at the parcel level. Each parcel is identified by the province to which the allocation is made (columns 1 and 2), the summation level (column 5), and the field type (column 6). The three summation levels are onshore total, offshore total, and (grand) total. For each summation level, there are two rows; oil fields and gas fields, respectively. The structure of the province summary totals table, sum_pt.tab, is the same as the province summary allocation table, sum_pa.tab, so that these files can be appended if desired. The only columns treated differently are columns 3, 4, and 5. |
| sum_reg.tab - Table contains summary results of the Monte Carlo calculations. Results are reported at the region level. Each region is represented by two rows, oil fields and gas fields, respectively. |
| sum_tps.tab - Table contains summary results of the Monte Carlo calculations. Results are reported at the total petroleum system level. Each total petroleum system is represented by two rows, oil fields and gas fields, respectively. |
| tpsvol.tab - Table contains volumetric data of discovered petroleum in regions, provinces, total petroleum systems, and assessment units. These volumes are the sum of volumes of individual fields reported in Petroconsultants (1996) and NRG Associates (1995). These tables contains 31 columns. NA means not applicable and is shown either in place of discovered volumes for which only one field is present, or for undiscovered volumes and values calculated from these volumes in assessment units not quantitatively assessed. |
Monte Carlo Simulation Programs [+]
|
Monte Carlo Simulation programs - from Chapter MC, World Petroleum Assessment 2000 (DDS 60)
|
| EMCEE and Emc2 are Monte-Carlo simulation programs for assessing undiscovered conventional oil and gas resources. EMCEE allows a variety of distribution types for input, while Emc2 works with a specific set of distributions. They run as spreadsheet workbooks in Microsoft Excel. EMCEE and Emc2 require Crystal Ball, a Monte Carlo simulation program from Decisioneering, Inc. that runs in Microsoft Excel. For futher information, refer to Chapter MC of DDS60. |
README Files [+]
Plots[+]
|
HP2 Plot Files from World Petroleum Assessment 2000 (DDS60)
|
| asm.hp2 - World Assessment Units Map |
| contin.hp2 - Continuous and Unconventional Resources Map |
| prov.hp2 - World Geologic Province Map |
| tps.hp2 - World Total Petroleum System Map |
World Geologic Maps
In support of the 2000 World Petroleum Assessment (DDS60), a series of geologic maps were captured, resulting in near global coverage of coarse resolution surface geology. Each of these maps were published as Open-File Reports on CD but are available for use in a variety of formats.
Access this content here.
Circum-Arctic Resources Appraisal
Access this content here.
Page Last Modified: Friday, October 05, 2012
|
|
Publication Search
A searchable database of thousands of published sources, dating back several decades
Find Data
USGS Energy Data Finder: Download GIS and tabular data, databases, geospatial web services (ArcGIS, WMS, KML)
EnergyVision
A single map viewer portal incorporating a range of maps, data and services
|