HAB Ecological Forecasting
The variety of HAB species, their broad geographic distribution, and the breadth of their impact on different ecosystem components create complex resource management issues that often require complex, integrative approaches to address them. Ecological forecasts are one type of integrative HAB research product that can assist coastal managers in better managing our resources.
HAB forecasts vary in function and complexity depending on the issue of concern and the data available. Forecasting models can assess HAB probability or project HAB movement (which can affect beach or shellfish closures), or they can be used to identify bloom sources (e.g., seed beds, eddies), “bloom triggers” (e.g., nutrients, water stratification), factors contributing to bloom decline (e.g., predation, water mixing), or factors that control bloom toxicity (e.g., cell density, environmental cues, toxin transfer through the food chain). The most complex HAB forecasting models are built from fundamental knowledge of biological, chemical, and physical dynamics in specific ecosystems and depend upon integration of that knowledge with data from various sources, which can include satellite imagery, monitoring partnerships, and in situ observations.
Below are two examples of NOAA funded research contributing to the development of regional HAB forecasts.
Karenia brevis in the Gulf of Mexico
NOAA's HAB Forecasting System in the Gulf of Mexico integrates satellite imagery, field observations, and buoy data to provide information on the location, extent, and potential for development or movement of harmful algal blooms in the Gulf of Mexico. The NOAA HAB Bulletin is distributed twice weekly to the management community, allowing early warnings to limit public exposure and to more effectively target sampling. The Bulletin is a collaborative effort of NOAA Center for Coastal Monitoring and Assessment, NOAA CoastWatch, NOAA Coastal Services Center, and NOAA/OCS Coast Survey Development Laboratory (CSDL), and is operational in NOAA's Center for Operational Oceanographic Products and Services (CO-OPS). In addition, several years of research supported by the ECOHAB Program helped to develop this HAB forecasting system and have produced an in-water sensor that can detect the Florida red tides and is used as a supplemental source of data.
The present bulletin uses measured wind velocities measurements from the Venice, FL Coastal-Marine Automated Network and a 1-D, Ekman transport type model. To augment the 1-D modeling strategy, CSDL has implemented a West Florida Shelf 2-D (NWFS-2D) model, whereby cross-shelf transport is computed along a transect perpendicular from the coast. This transect emanates from a point approximately midway between Tampa Bay and Charlotte Harbor and extends approximately 875 km into the Gulf of Mexico. The model is initialized using the temperature and salinity fields from the NOS/CSDL Gulf of Mexico model (NGOM) that routinely produces daily nowcast/forecasts for the Gulf. The model is forced with wind data from the C-MAN station. The HAB particle movements are simulated in NWFS-2D using massless and point line Lagrangian particles. This model is run on a daily basis at CSDL and the output is emailed to several HAB investigators in the form of the graphic shown in Figure 1. The four panels represent the paths of four different particle ensembles. Also given on this graphic is a plot of the along-shore wind stress, with a negative value indicative of upwelling. The WFS-2D model is currently being evaluated at NOAA’s National Centers for Coastal Ocean Science (NCCOS) and Center for Operational Oceanographic Products and Services (CO-OPS).
 |
 |
 |
 |
 |
| Figure 1. A sample HAB graphic produced by the 2D cross-shelf transport model. |
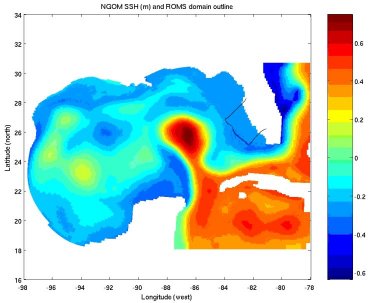
Even though the 2-D model may produce very useful insights, it cannot simulate 3-D physical processes in the Gulf of Mexico, e.g. alongshore transport and the effects of the loop current. While the 2-D model is being vetted in the production of the Bulletin, CSDL is implementing a full 3-D West Florida shelf model. This model is identified as the NWFS-3D, and its implementation is based on the Regional Ocean Modeling System (ROMS). It is fully coupled with the NGOM model so that the initial conditions, model surface and lateral boundary conditions are provided by the latter; the wind forcing is provided by a Coupled Ocean/Atmosphere Mesoscale Prediction System (COAMPS) product; and monthly climatological heat fluxes are imposed. The coupled model domains are shown in Figure 2.
 |
 |
| Figure 2. The NGOM model domain (left) with ROMS sub-domain and NWFS-3D model grid (right). Red dots on figure on the right indicate NGOM grid locations. |
The NGOM computational grid is relatively uniform over the WFS with a model resolution of 5-6 km. The NWFS-3D grid has a nominal grid resolution on the shelf of 800 m and is further refined in the Tampa Bay and Charlotte Harbor regions to a model resolution of 400 m. For both the NGOM and NWFS-3D the bathymetry is derived from National Ocean Service (NOS) soundings.
In the planned hindcasts, the HAB concentrations will be initialized based on locations extracted from (digitized) daily satellite chlorophyll concentration plots which have been shown by independent measurement to represent the algal species Karenai Brevis. An example of a satellite image is shown in Figure 3(a). HAB movements will be simulated using massless, point-like Lagrangian particles; a preliminary simulation is shown in Figure 3(b) where the initial particle locations are in black and their final locations are in magenta. It is seen that particles show movement, but remain confined to their respective patches. Various particle behaviors (eg. swimming, etc.) could also be included and investigated.
 |
 |
| Figure 3. (A) Satellite image of Chlorophyll concentration |
Figure 3. (B) Sample 8-day ROMS particle simulation. |
A Live Access Server (LAS) has been established whereby both the general public and scientific investigators can download the daily model products from the NGOM/NWFS-3D modeling system. In summary, NOS/CDSL has implemented a modeling strategy to continue the evolution of circulation models from the initial 1-D approach, to 2-D, and then fully 3-D models to address the challenging issues associated with the prediction of the initiation and fate of HABs along the West Florida shelf. Modeling techniques developed for this region can and will be applicable for other regions with HAB concerns in U.S. coastal waterways. Further detail on the project is available here for viewing and download.
Harmful Algal Bloom (HAB) Forecast Guidance in Chesapeake Bay
Various noxious and toxic harmful algal blooms (HAB) afflict the Chesapeake Bay, posing threats to human health and natural resources. Knowing where and when to expect these biotic nuisances may help mitigate their effects.
It has long been recognized that certain combinations of physical, chemical, and biotic conditions give rise to "bloom" events. For example, a specific algal bloom may form if a "seed" population exists in a water column when environmental conditions, such as light level and nutrient concentrations, become favorable for that species. Accordingly, if the environmental conditions necessary for the growth and maintenance of an organism are adequately defined, i.e. its habitat, one should be able to predict the potential occurrence of the organism if one can estimate the relevant conditions.
This program uses a combination of phyical modeling, satellite imagery and real time measurements to delineate the extent in time and space of the most likely habitat for HAB in the bay. Because this technique does not attempt to mechanistically "grow" HABs it will never be a precise predictor of the occurance of HABs. But, by giving environmental managers information about areas of most likely occurance it serves as an aid in focusing their sampling programs and allowing the response to HAB events to be as efficient as possible.
Daily runs of a sophisticated numerical model of the Chesapeake Bay provide oceanographic predictions from which a field estimate of the HAB probability is derived. The model includes the second generation forecast system of Chesapeake Bay (CBEFS2) for physical variables and a bio-geochemical model of water quality which includes the parameters of nutrients, phytoplankton and zooplankton. These HAB probability fields are displayed to the public on a web site with GIS interfaces. This project is still in early research and is a collaboration with the University of Maryland, and Maryland Department of Natural Resources. |