NASA header National Aeronautics and Space Administration Global Climate Change: Vital Signs of the Planet National Aeronautics and Space Administration
Blog banner
Dr. Amber Jenkins

Amber Jenkins is Editor of NASA's Climate Change website and project manager of the Center for Climate Sciences at NASA's Jet Propulsion Laboratory. She's passionate about climate change, science and science communication.

More ›

Climate change chronicles from NASA


Mission to Planet Earth
Our new climate kids’ site off with a bang!
January 28, 2010
posted by Dr. Amber Jenkins
16:00 PST

Kids site

Climate change can be a daunting topic for most adults to grasp, let alone kids. That’s why we’ve just launched the kids’ version of our website, called “Climate Kids”, to help.

The site, which is geared towards students in grades 4 through 6, is, like our parent Global Climate Change website, rich in visuals and multimedia that help convey the science behind climate change. Ever wondered what a water balloon can teach us about climate change? Maybe not, but the kids’ site will tell you more. There’s also a “Climate Time Machine” that travels back and forth in time, illustrating the different climate change that has gone on in years gone by, and games such as “Go Green” and “Wild Weather Adventure”. The website endeavors to answer some of the big questions related to climate change, in a kid-friendly way.

Kids are the future. The planet is theirs. Hopefully our website can shine a little light on how our planet is changing and what their future might hold. You can find the kids' site linked from our home page.

comments ( )

No child left inside
Kids checking up on NASA’s observations
January 28, 2010
posted by Dr. Amber Jenkins
16:00 PST

From Patrick Lynch, NASA's Earth Science News Team

The S'COOL program has been encouraging students to help verify NASA satellite measurements and learn about clouds and climate for 13 years now. Credit: Science Directorate, NASA Langley Research Center The S'COOL program has been encouraging students to help verify NASA satellite measurements and learn about clouds and climate for 13 years now. Credit: Science Directorate, NASA Langley Research Center.

Most scientific observations are made by the most sophisticated of instruments. We build miles-long particle accelerators to see the smallest bits of atoms. We send bus-sized satellites all the way out to space to observe the science happening in our planet’s atmosphere. Sometimes, though, a machine just won’t do. Sometimes a school kid looking up at the sky does the job quite well.

That is the premise of NASA’s S’COOL (Students’ Cloud Observations On-Line) project. While a satellite passes overhead observing the radiation given off by Earth, S’COOL participants look upwards and take careful notes on the type and multitude of clouds in the sky.

This is not just for fun, and it's not just to get children and teens interested in the basics of atmospheric science. These observations are put to use by NASA scientists to verify that a satellite instrument overhead — the Clouds and the Earth’s Radiant Energy System (CERES) sensor — is accurately observing clouds from above. In some cases, CERES’ radiometers (energy-measuring devices) may interpret a glare or a land feature as a cloud. Student observations act as what’s known as a “ground truth” method to make sure the satellite is accurate.

The more observations, the better. In this regard, the gold star goes to the students at Chartiers-Houston Jr./Sr. High School in Houston, Pa. These students have made more than 5,000 observations for the S’COOL folks at NASA’s Langley Research Center. (5,276 observations as of 10 January, to be exact.) The number is a record and nearly the doubles the total reported by any other school.

The S’COOL program is beginning its 14th year and has inspired school children in more than 75 countries to take their cloud charts outside. Chartiers-Houston has long been among the most active in the program. Students can make observations anytime, but ideally they walk outside at the precise time that the satellite is passing over their town. They must know the types of clouds and know the recording methods to make useful observations. This requires, in other words, dedication.

Science teacher Gary Popiolkowski, who’s been leading students outside to look skyward since 2000, said he likes S’COOL because it allows students to get “involved doing real science, acting like real scientists.” He said his students even make observations after school and on weekends, on their own time.

“My students have developed a sense of pride in continuing our observations over the years,” he said. “Besides recording the scheduled observations, we also identify the clouds each period throughout the day as a daily class starter. S’COOL is integrated into our weather unit and fits into my philosophy of “no child left inside” as we constantly 'look up' anytime we are outside.”

Cross posted and adapted from NASA’s What on Earth blog. Patrick is based at NASA’s Langley Research Center in Virginia.

comments ( )

Pick of the pics
Aland Islands, Finland
January 28, 2010
posted by Dr. Amber Jenkins
16:00 PST

Courtesy of NASA/USGS Landsat mission. Courtesy of NASA/USGS Landsat mission.

The Aland Islands are located in the Baltic Sea between eastern Sweden and southwestern Finland. They consist of the main island, Fasta Aland, which contains 90 percent of the population, and an archipelago to the east that is made up of over 6,500 islands. Approximately 25,000 inhabitants live on only 65 of the islands. This image was taken by the Landsat 7 satellite on April 19, 2003.

comments ( )

Sky-high aspirations
Citizen science
January 22, 2010
posted by Dr. Amber Jenkins
16:00 PST

Matt Rogers

From Dr. Matt Rogers, Research scientist, Colorado State University

Matt Rogers works on the CloudSat project, an international mission run by NASA’s Jet Propulsion Laboratory, Colorado State University and others. Matt has just returned a student climate change conference in Thailand.

Stepping off the plane in Phuket, Thailand after leaving some thirty hours before from Colorado was quite a temperature shock. Having just crunched through the snow on my front porch, I was now in the tropics, attending the Climate Change Education and Earth System Science workshop representing the CloudSat Education Network. CloudSat, NASA’s cloud-watching satellite mission, has several schools in Thailand engaged in cloud observations, which we use to calibrate CloudSat data products. I had planned to hold a two-day, pre-conference workshop where I would work with students and teachers on understanding the basics of clouds and climate change. Little did I know, standing there in the hot Phuket sun, exactly how much science I would be looking at in the days to come.

Matt Rogers

The workshop went great. Nearly fifty students aged 12-18 from all over Thailand attended, and with the help of graduate students and faculty from nearby Walailak University, who were hosting the conference in conjunction with the Thai Institute for the Promotion of Teaching of Science and Technology (IPST), we spent the two days going through a whirlwind of science topics. We answered questions about climate change and developed new strategies for students to do science research, both in Thailand and in partnership with our CloudSat-affiliated schools in the U.S.

Then, the conference started — nearly 200 students and teachers, presenting research from the last year. The spectrum of topics was incredible. They ranged from investigating the effect of clouds on radio transmission to developing techniques to estimate the amount of rainfall using CloudSat data (and validating their results using rain measurement gauges!). Students had tracked the effect of ground cover on rubber tree cultivation and had studied the increasingly earlier budburst of local flowering trees, which they linked to local climate change in their province. They are engaged in relevant and cutting-edge climate research, and the results they are obtaining are astonishing.

I've made many new friends in the last couple of days, renewed old friendships and watched in wonder as student scientists take the lead in important climate research. I know that these kids are walking away from this conference with a greater understanding of how we observe the Earth and its climate from space, but I also know that I leave this place with a wealth of knowledge gained by listening to the next generation of scientists presenting their research. And based on what I've seen in here in Thailand, the future is a bright one indeed.

--Matt Rogers

comments ( )

Pick of the pics
Bombetoka Bay, Madagascar
January 14, 2010
posted by Dr. Amber Jenkins
16:00 PST
Pick of the pics
Courtesy of NASA/Goddard Space Flight Center, Japan's Ministry of Economy, Trade and Industry, Japan's Earth Remote Sensing Data Analysis Center, the Japan Resources Observation System, and the U.S./Japan ASTER Science Team.

This image of Bombetoka Bay in northwestern Madagascar was taken in August 2000 by NASA’s Advanced Spaceborne Thermal Emission and Reflection Radiometer (ASTER) instrument. Bombetoka Bay is an inlet of the Mozambique Channel, which separates Madagascar from Africa to the west. In the picture, water is sapphire and tinged with pink where sediment is particularly thick. Dense vegetation can be seen in deep green.

Just downstream is the second largest port of Madagascar — the town of Mahajanga — a road terminus and trade center that exports among other things sugar, coffee, spices, timber and vanilla. The surrounding area contains extensive coffee plantations.

comments ( )

Waves in the bathtub
Why sea level rise isn’t level at all
January 11, 2010
posted by Dr. Amber Jenkins
16:00 PST

Josh Willis

From Dr. Josh Willis, NASA/Jet Propulsion Laboratory oceanographer

Rubber duck in bath.

This famous climate scientist I know used to always begin his talks on sea level rise by showing a cartoon of a bathtub. A faucet would fill up the bathtub, representing water coming from melting glaciers and ice sheets, and then a small campfire would add heat, causing the water to expand. It was a nice way of getting people to think about the causes of sea level rise. But you might guess that the real ocean is a bit more complicated than the cartoon lets on. And you’d be right. Even though it’s sometimes convenient to think of the ocean as a great big bathtub, where turning on the tap at one end raises the water level in the whole tub, real sea level rise doesn’t quite happen that way. To understand why, you first have to realize that ‘sea level’ isn’t really level at all.

There are lots of reasons why the oceans are not level. For example, vast ocean currents like the Gulf Stream in the Atlantic Ocean and the Kuroshio in the Pacific actually reshape the ocean surface, causing it to tilt. As the planet heats up, changes in the prevailing winds (which drive most of these ocean currents) cause changes in the currents, reshaping our ocean and changing local sea level as a result.

Just as global warming does not raise land temperatures evenly, global ocean warming is not the same everywhere around the globe. Some regions of the oceans are heating up faster than others, and because warm water takes up more space than cold water, those regions experience faster sea level rise.

Finally, the water locked away in the great ice sheets of Greenland and Antarctica also shapes the ocean surface. As the ice sheets melt and lose water to the oceans, our entire planet feels the effects. The movement of mass from the ice sheets to the oceans very slightly shifts the direction of Earth’s rotation. This, along with changes in the gravitational pull of the ice sheets on the oceans, will reshape sea levels further still.

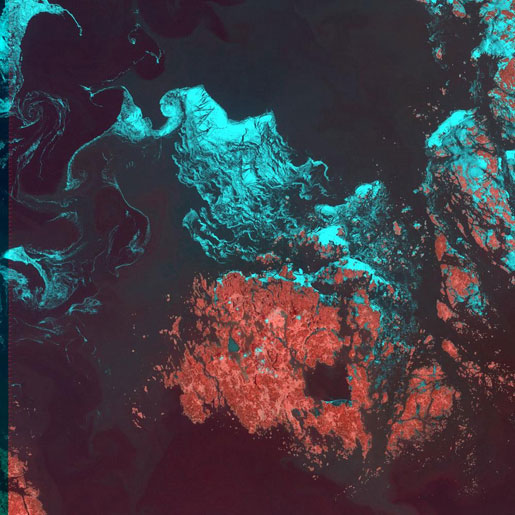
So sea level rise is complicated, and the bathtub analogy just doesn’t cut it. Given all that, the image below is not that surprising. It shows how sea levels changed between 1993 and 2008 (yellow and red show rising sea levels, blue and green show falling). Since the early 1990s, space satellites have given us a bird’s-eye view of sea level change. They tell us that that sea level, averaged over the whole planet, has gone up by about 4.5 cm (1.8 inches) since 1993 — clear evidence of global warming. (To recap: global warming causes a) ocean water to warm up, expand, and take up more space; and b) glaciers to melt which add more water to the oceans.) But the patterns of sea level change tell a much more complicated story.

Most of the regional variations seen over this 16-year trend are related to changes in the ocean currents rather than the movement or melting of ice. Australia for example, where 80% of the population lives near the coast, has seen sea levels rise much more quickly than the rest of the planet. Meanwhile, along the California coast, sea level has stayed steady or even fallen a bit.

The question is whether these regional differences are part of natural climate cycles, or an effect of global warming? The answer is probably both, and scientists around the world are working hard to tell the difference.

So where does all this leave my friend’s bathtub analogy? High and dry, of course.

The change in the world’s sea level between 1993 and 2008. Black areas are land; colored are the oceans. Yellow and red regions show rising sea level, while green and blue regions show falling sea level. White regions are missing data during parts of the year. Nearly everywhere, sea level is rising, and the global average is clearly rising fast. But the patterns of sea level change (the regional variations) are complicated. </br></br>Credit: Altimeter data products include data from TOPEX/Poseidon, Jason-1 and Jason-2 and other satellites. Data products come from Ssalto/Duacs, distributed by Aviso, with support from CNES. The change in the world’s sea level between 1993 and 2008. Black areas are land; colored are the oceans. Yellow and red regions show rising sea level, while green and blue regions show falling sea level. White regions are missing data during parts of the year. Nearly everywhere, sea level is rising, and the global average is clearly rising fast. But the patterns of sea level change (the regional variations) are complicated.

Credit: Altimeter data products include data from TOPEX/Poseidon, Jason-1 and Jason-2 and other satellites. Data products come from Ssalto/Duacs, distributed by Aviso, with support from CNES.

Editor's note: If you're interested in how sea level is changing around the globe check out our Climate Time Machine and Sea Level Viewer.

comments ( )

Word games
Same words but different meanings
January 11, 2010
posted by Dr. Amber Jenkins
16:00 PST

From Adam Voiland, NASA Earth Science News Team

Word games


Earth scientists milling around the lobby during coffee breaks at the American Geophysical Union’s fall meeting in San Francisco in December had something unusual to mull over. A phalanx of colorful posters, created by a visual communicator who describes herself as "a note taker on steroids", adorned the lobby of the Moscone Convention Center. Snippets from the illustrated notes offer a fascinating look into some of the brainstorming sessions that have taken place on the topic of communicating climate science. AGU intstalled the posters at a fitting time: it's been a disorienting month for climate scientists who have watched seemingly specious charges of scientific malpractice become a major news item.

One of the posters — called Communicating with Congress (and Everybody Else) — brainstorms some of the pitfalls that make communicating climate science such a challenge. High on the list: jargon. Scientists use such a specialized language that it can be difficult for non-scientists to distill the meaning from certain scientific presentations or articles. Complicating matters more, there are some words that have distinctly different meanings to scientists and to the public. The poster highlighted a handful of them. I've taken the liberty of elaborating upon and defining a few of them below.

Did you know the difference? Have any good examples to add to the list?

Aerosols

  • The Public: Spray cans that dispense a liquid mist, many of which damage Earth's ozone layer.
  • Scientists: A suspension of any solid or liquid droplet in the atmosphere. Includes dust, soot, pollen, sea salt, sulfates and more.

Radiation

  • The Public: Harmful material that leaks from nuclear material and is used to battle cancer.
  • Scientists: Energy that comes from a source and travels through some material or space. Includes electromagnetic radiation such as radio waves, infrared light, visible light, ultraviolet light and X-rays.

Ozone

  • The Public: Something in our atmosphere that protects against cancer-causing light waves.
  • Scientists: A molecule containing three oxygen atoms that, in different parts of the atmosphere, acts as a harmful air pollutant, a heat-trapping greenhouse gas, and a buffer against ultraviolet radiation.

Error

  • The Public: A mistake, an accidental wrong action or a false statement not made deliberately.
  • Scientists: Not a mistake; instead the difference between a computed, estimated or measured value and the true, or theoretically correct, value.

Bias

  • The Public: Willful manipulation of facts to suit a particular ideology or point of view.
  • Scientists: A term used to describe a statistical sample in which members of the sample are not equally likely to be chosen. Also a term used to describe the difference between an estimator's expectation and the true value of the parameter being estimated. For some scientific analyses, a certain degree of bias can actually be beneficial.

Communicating with Congress

Cross posted and adapted from NASA’s What on Earth blog. Adam is based at NASA’s Goddard Space Flight Center outside Washington, D.C.

comments ( )