
Census.gov > Data > Data Visualization Gallery > I-90 Population Density Profile, 2010
Data
I-90 Population Density Profile, 2010
November 1, 2012
Passing through some of the most sparsely populated territory in the country, I-90 connects Seattle, Chicago, Cleveland, Buffalo, and Boston. Selected cities along the route are labeled, for reference, with cities of 250,000 or more shown in bold and with filled circles.
SOURCE: 2010 Census.
NOTE: The graph is based on average population density within 5 miles of the I-90 route, in 2-mile increments, using 2010 block group centroids.
Recent Data Visualizations
 Migration Between Calif. & Other States
 U.S. Territory and Statehood Status
 Spoken Languages Other than English
 Center of Population, 1790-2010
 Population Change by Decade
 Without A High School Education
 A Decade of State Population Change
 State-to-State Migration for States of 8 Million or More
 Population Under 5 Years Old by Congressional District
 Components of Metro Area Change
 Blooming States
 Coastline County Population
 Coastline County Population
 I-90 Population Density Profile, 2010
 Second Cities: Keeping Pace with a Booming New York
 By the Grid: Population Shift to the West and South
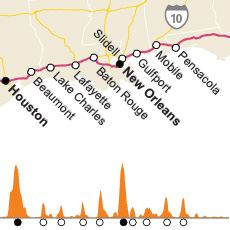 I-10 Population Density Profile, 2010
 Booming Cities Decade-to-Decade, 1830-2010
 I-5 Population Density Profile, 2010
 Islands of High Income
 The Great Migration, 1910 to 1970
 Following the Frontier Line, 1790 to 1890
 Changing Ranks of States by Congressional Representation
 Cartograms of State Populations in 1890, 1950, and 2010
 Before and After 1940: Change in Population Density
 From Physical to Political Geography
 Differential City Growth Patterns
 I-95 Population Density Profile
 Increasing Urbanization
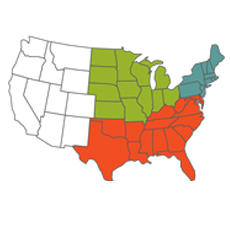 Gaining and Losing Shares
 Top 20 Cities
 Email Updates
 Facebook
 Twitter
 Flickr
 YouTube