Latitude/Longitude Disclaimer: The gauge location shown in the above map is the approximate location based on the latitude/longitude coordinates provided to the NWS by the gauge owner.
Gauge Information
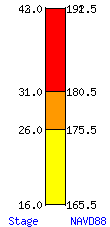
Flood Categories (in feet)
Major Flood Stage:
42
Moderate Flood Stage:
31
Flood Stage:
26
Action Stage:
16
Historical Crests (1) 43.00 ft on 07/11/1994 (2) 37.84 ft on 04/21/1925 (3) 36.92 ft on 03/11/1998 (4) 34.70 ft on 03/07/1966 (5) 34.40 ft on 03/20/1929 Show More Historical Crests
Low Water Records (1) 0.30 ft on 08/10/1946 (2) 1.19 ft on 10/05/2001 (3) 1.52 ft on 01/04/2002 Show More Low Water Records
Graphical representation of flood inundation for NWS flood categories are based on steady state hydraulic modeling of water surface elevations for incremented discharges. Map shows approximate inundation areas for given water surface elevations and should not be used for navigation or permitting or other legal purposes, but strictly as a planning reference tool.
Extended rating:
Rating Curve Extension - The Rating Curve Extension is calculated by using either a linear, logarithmic, or hydraulic technique to extend the rating curve above the currently established relationship between stage and flow.
Flood Impacts
47.5
Western approach to Broad Avenue Bridge begins to flood.
44.6
Approaches to Liberty Expressway Bridge begin to flood.
44.5
Eastern approach to Broad Avenue Bridge begins to flood.
44
Water is at the top of the Atlantic Coast Line Railroad Bridge.
42
Major flooding begins. Water is at the top of the Georgia Northern Railroad and reach the gauge site.
39
Flood water will reach the floor of the sewage plant and nearby houses. Radium Springs Road begins to flood.
37
Ragsdale area will be inundated with flood waters. Above this level...Albany College and houses along Hazard Drive will begin to flood.
36.7
Approaches to East Oglethorpe Bridge begins to flood.
31
Moderate flooding begins. Highland Avenue and some cottages at Lovers Lane Road at Lake Chehaw will see some flooding.
30.9
Approaches to Oakridge Drive Bridge begin to flood.
29
Flooding will begin in the lowest elevations along Third Avenue...Highland Avenue...and Front Street.
The National Weather Service prepares its forecasts and other services in collaboration with agencies like the US Geological Survey, US Bureau of Reclamation, US Army Corps of Engineers, Natural Resource Conservation Service, National Park Service, ALERT Users Group, Bureau of Indian Affairs, and many state and local emergency managers across the country. For details, please click here.
Graphical representation of flood inundation for NWS flood categories are based on steady state hydraulic modeling of water surface elevations for incremented discharges. Map shows approximate inundation areas for given water surface elevations and should not be used for navigation or permitting or other legal purposes, but strictly as a planning reference tool.