

Note: To view publications, the DjVu Browser Plugin or Adobe Reader is required.
A statewide study was conducted to develop regression equations for estimating six selected low-flow frequency statistics and harmonic mean flows for ungaged stream sites in Iowa. The estimation equations developed for the six low-flow frequency statistics include: the annual 1-, 7-, and 30-day mean low flows for a recurrence interval of 10 years, the annual 30-day mean low flow for a recurrence interval of 5 years, and the seasonal (October 1 through December 31) 1- and 7-day mean low flows for a recurrence interval of 10 years. Estimation equations also were developed for the harmonic-mean-flow statistic. Estimates of these seven selected statistics are provided for 208 U.S. Geological Survey continuous-record streamgages using data through September 30, 2006. The study area comprises streamgages located within Iowa and 50 miles beyond the State’s borders.
These regression equations will be implemented within the U.S. Geological Survey StreamStats web-based geographic-information-system tool. StreamStats allows users to click on any ungaged site on a river and compute estimates of the seven selected statistics; in addition, 90-percent prediction intervals and the measured basin characteristics for the ungaged sites also are provided. StreamStats also allows users to click on any streamgage in Iowa and estimates computed for these seven selected statistics are provided for the streamgage.
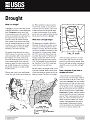
A drought is a period of drier-than-normal conditions that results in water-related problems. Precipitation (rain or snow) falls in uneven patterns across the country. The amount of precipitation at a particular location varies from year to year but, over a period of years, the average amount is fairly constant. In the deserts of the Southwest, the average precipitation is less than 3 inches per year. In contrast, the average yearly precipitation in some parts of the Northwest is more than 150 inches.

Drought Monitoring with VegDRI
Drought strikes somewhere in the United States every year, turning green landscapes brown as precipitation falls below normal levels and water supplies dwindle. Drought is typically a temporary climatic aberration, but it is also an insidious natural hazard. It might last for weeks, months, or years and may have many negative effects. Drought can threaten crops, livestock, and livelihoods, stress wildlife and habitats, and increase wildfire risks and threats to human health.
Drought conditions can vary tremendously from place to place and week to week. Accurate drought monitoring is essential to understand a drought's progression and potential effects, and to provide information necessary to support drought mitigation decisions. It is also crucial in light of climate change where droughts could become more frequent, severe, and persistent.

Effects of Climate Variability and Change on Groundwater Resources of the United States
Groundwater is an important part of the global fresh water supply and is affected by climate. U.S. Geological Survey (USGS) scientists are working with local, State, Federal, and international partners to understand how the availability and sustainability of groundwater resources in the United States will be affected by climate variability and change. This fact sheet describes climate variability and change, important groundwater resources of the Nation, and how USGS research is helping to answer critical questions about the effects of climate on groundwater.
Relation of baseflow to row crop intensity in Iowa
Increasing baseflow and baseflow percentage over the second half of the 20th century in Iowa has contributed to increasing nitrate-nitrogen concentrations measured in Iowa rivers because nitrate is primarily delivered to streams as baseflow and tile drainage. The relation of baseflow and baseflow percentage to row crop land use was evaluated for 11 Iowa rivers and their watersheds for their period of streamflow record (58–73 years period). Results indicated increasing baseflow in Iowa’s rivers is significantly related to increasing row crop intensity. A 13–52% increase in row crop percentage in many Iowa watersheds has contributed to an increase of 33–135 mm increase in baseflow and 7–31% increase in baseflow percentage. Limited historical water quality data from two larger Iowa rivers (Cedar and Raccoon rivers) suggest that increasing row crop land use over the 20th century has produced more baseflow and contributed to increasing nitrate concentrations in Iowa’s rivers.

Incresed baseflow in Iowa over the second half of the 20th century
Historical trends in annual discharge characteristics were evaluated for 11 gauging stations located throughout Iowa. Discharge records from nine eight-digit hydrologic unit code (HUC-8) watersheds were examined for the period 1940 to 2000, whereas data for two larger river systems (Cedar and Des Moines Rivers) were examined for a longer period of record (1903 to 2000). In nearly all watersheds evaluated, annual baseflow, annual minimum flow, and the annual baseflow percentage significantly increased over time. Some rivers also exhibited increasing trends in total annual discharge, whereas only the Maquoketa River had significantly decreased annual maximum flows. Regression of stream discharge versus precipitation indicated that more precipitation is being routed into streams as baseflow than as stormflow in the second half of the 20th Century. Reasons for the observed streamflow trends are hypothesized to include improved conservation practices, greater artificial drainage, increasing row crop production, and channel incision. Each of these reasons is consistent with the observed trends, and all are likely responsible to some degree in most watersheds.

Statistical summaries of selected Iowa streamflow data through September 1996
Statistical summaries of streamflow data collected at 156 streamflow-gaging stations in Iowa are presented in this report. All gaging stations included for analysis have at least 10 years of continuous record collected before or through September 1996. The statistical summaries include (1) statistics of monthly and annual mean discharges; (2) monthly and annual flow durations; (3) magnitudes and frequencies of instantaneous peak discharges (flood frequencies); and (4) magnitudes and frequencies of high and low discharges. Also presented for each gaging station is a graph of the annual mean flows and, for most stations, selected values from the most-recent stage-discharge rating table.

Statistical summaries of selected Iowa streamflow data through September 30, 1988
Statistical summaries of streamflow data collected at 144 active and discontinued stream-gaging stations in Iowa through water year 1988 are presented in the report. The summaries for each streamgaging station include: 1) station description, 2) the most recent stage-discharge rating table, 3) statistics of monthly and annual mean discharges, 4) boxplots of monthly and annual mean discharges, 5) monthly and annual flow durations, 6) probabilities of annual high discharges, 7) probabilities of annual low discharges, and 8) probabilities of seasonal low discharges. The minimum period of record at stations included in the report is 10 years. The location of each station is shown on a map of Iowa.

National water summary 1988-89: hydrologic events and floods and droughts
National Water Summary 1988-89 Hydrologic Events and Floods and of Droughts documents the occurrence in the United States, Puerto Rico, and the U.S. Virgin Islands of two types of extreme hydrologic events floods and droughts on the basis of analysis of stream-discharge data. This report details, for the first time, the areal extent of the most notable floods and droughts in each State, portrays their severity in terms of annual peak discharge for floods and annual departure from long-term discharge for droughts for selected stream-gaging stations, and estimates how frequently floods and droughts of such severity can be expected to recur.
Annual and seasonal low-flow characteristics of Iowa streams
The low-flow characteristics of Iowa streams are described by annual and seasonal low-flow frequency and duration data. Tabulated in this report are low-flow data collected at 135 gaging stations on Iowa streams, three on the Mississippi River, four on the Missour River, and 426 partial-record sites. The information contained in this report is based on all of the daily discharge records collected by the U.S. Geological Survey through the 1976 water year. Consideration is given to the regional aspects of low-flow characteristics by including regression equations to estimate the average discharge and generalized maps to estimate the 7-day, 2-year and 7-day, 10-year discharges at ungaged sites. (Kosco-USGS)
Plates [1, 2]