| [+] Home ISLSCP II CARBON DIOXIDE EMISSIONS FROM FOSSIL FUELS, CEMENT, AND GAS FLARING | [+]Help @Email | ||
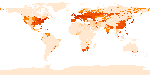
| This data set contains decadal (1950, 1960, 1970, 1980, 1990 and 1995) estimates of gridded fossil-fuel emissions, expressed in 1,000 metric tons C per year per one degree latitude by one degree longitude. The CO2 emissions are the summed emissions from fossil-fuel burning, hydraulic cement production, and gas flaring. The years 1950 to 1990 were developed and compiled using somewhat different procedures and information than the 1995 data. The national annual estimates (Boden et al.,1996) from 1950 to 1990 were allocated to one degree grid cells based on gridded information on national boundaries and political units, and a 1984 gridded human population map (Andres et al., 1996). For the 1995 data, the population data base developed by Li (1996a) and documented by CDIAC (DB1016: Li,1996b) was used as proxy to grid the 1995 emission estimates.
[+] Visualize in Google Earth [+] View Full Metadata [+] Order data set in ORNL DAAC archive (non-WCS) format [+] One-click download this data set Use the links in the table below to view and download data using WCS. |
|||
| This data set contains 12 data granules | ||||||||||||||||||||||||||||||||||||||||||||||||||||||||||||||||||||||||||||||||
|
||||||||||||||||||||||||||||||||||||||||||||||||||||||||||||||||||||||||||||||||
|
||||||||||||||||||||||||||||||||||||||||||||||||||||||||||||||||||||||||||||||||
| Tel: +1 (865) 241-3952 E-mail: USO |
ORNL DAAC | User Services | WebGIS | NASA |  |
||