


Technical Assistance
Need help improving the conditions for learning in your school, district, state, or institution? Get Help
Upcoming Events
Supportive School Discipline Webinar Series: Addressing Truancy-- Innovative Approaches to Systemically Increasing Attendance and Reducing Chronic Truancy
February 27, 4:00-5:30 pm ET
What's New
HHS/Office of Adolescent Health Updates State-by-State Adolescent Mental Health Facts. The Department of Health and Human Services Office of Adolescent Health has recently updated its state summaries that focus on adolescent mental health. Each state page reports on positive social skills, depressive symptoms, depressive episodes and suicidal thoughts, attempts, and injuries. Learn More
Data Trends and Indicators |
There are a number of data and indicators that can help inform the Nation on the nature of school climate. Below are a selection of national indicators from the Youth Risk Behavior Surveillance System (YRBSS) that can help provide context.
In addition, a report called, Indicators of School Crime and Safety: 2011, presents data on crime at school from the perspectives of students, teachers, principals, and the general population from an array of sources--the National Crime Victimization Survey, the School Crime Supplement to the National Crime Victimization Survey, the Youth Risk Behavior Survey, the School Survey on Crime and Safety and the School and Staffing Survey. Data on crime away from school are also presented to place school crime in the context of crime in the larger society. Click here to read more.

Indicator 1: Percentage of Students Ages 12–18 Who Reported Being Targets of Hate-Related Words at School (various years, 2001–2009).
View Larger

Indicator 2: Percentage of students in grades 9–12 who reported using alcohol anywhere at least one day during the previous 30 days (various years, 1993–2011)
View Larger

Indicator 3: Percentage of Students in Grades 9–12 Who Reported Using Alcohol On School Property at Least One Day During the Previous 30 Days (various years, 1993–2011)
View Larger

Indicator 4: Percentage of students ages 12–18 who reported being bullied at school and cyber-bullied anywhere during the school years 2006–7 and 2008–9.
View Larger

Indicator 5: The Rate of Violent Victimizations Per 1,000 Students at School (2008–2010)
View Larger

Indicator 6: Percentage of High School Students Who Reported Attempted Suicide during the 12 months before the survey (various years 1993–2011)
View Larger

Indicator 7: Percentage of High School Students were Overweight (various years, 1999–2011).
View Larger
Indicator 1: Percentage of Students Ages 12–18 Who Reported Being Targets of Hate-Related Words at School (various years, 2001–2009).

NOTE: "At school" includes the school building, on school property, on a school bus, and, from 2001 onward, going to and from school. Hate-related refers to derogatory terms used by others in reference to students’ personal characteristics. For both 2007 and 2009, the reference period was the school year, whereas in prior survey years the reference period was the previous 6 months. Cognitive testing showed that estimates from 2007 and 2009 are comparable to previous years.
SOURCE: U.S. Department of Justice, Bureau of Justice Statistics, School Crime Supplement (SCS) to the National Crime Victimization Survey, various years, 2001–2009.
Indicator 2: Percentage of students in grades 9–12 who reported using alcohol anywhere at least one day during the previous 30 days (various years, 1993–2011)

NOTE: The term "anywhere" was not used in the YRBS questionnaire; students were simply asked how many days did they have at least one drink of alcohol during the past 30 days.
SOURCE: Centers for Disease Control and Prevention, National Center for Chronic Disease Prevention and Health Promotion, Youth Risk Behavior Surveillance System (YRBSS), various years, 1993–2011.
Indicator 3: Percentage of Students in Grades 9–12 Who Reported Using Alcohol On School Property at Least One Day During the Previous 30 Days (various years, 1993–2011)

NOTE: "On school property" was not defined for survey respondents. In the YRBSS questionnaire, students are simply asked how many days they had at least one drink of alcohol in the past 30 days on school property.
SOURCE: Centers for Disease Control and Prevention, National Center for Chronic Disease Prevention and Health Promotion, Youth Risk Behavior Surveillance System (YRBSS), various years, 1993-2011.
Indicator 4: Percentage of students ages 12–18 who reported being bullied at school and cyber-bullied anywhere during the school years 2006–7 and 2008–9.

NOTE: "At school" includes the school building, on school property, on a school bus, or going to and from school. Bullying types do not sum to total because students could have experienced more than one type of bullying. In 2006-2007, the unit response rate for this survey did not meet NCES statistical standards; therefore, interpret the data with caution.
SOURCE: U.S. Department of Justice, Bureau of Justice Statistics, School Crime Supplement (SCS) to the National Crime Victimization Survey, 2007 and 2009.
Indicator 5:The Rate of Violent Victimizations Per 1,000 Students at School (2008–2010)
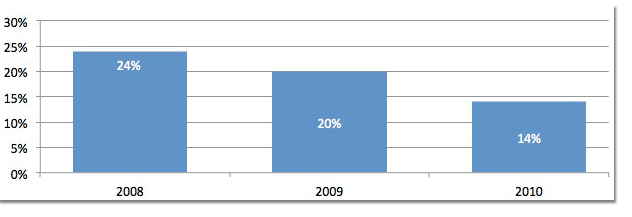
NOTE: "Violent victimization" includes serious violent crimes and simple assault. Serious violent crimes include rape, sexual assault, robbery, and aggravated assault. "At school" includes inside the school building, on school property, or on the way to or from school.
SOURCE: U.S. Department of Justice, Bureau of Justice Statistics, National Crime Victimization Survey
Indicator 6: Percentage of High School Students Who Reported Attempted Suicide during the 12 months before the survey (various years 1993–2011)

NOTE: 95% confidence interval.
SOURCE: Centers for Disease Control and Prevention, National Center for Chronic Disease Prevention and Health Promotion, Youth Risk Behavior Surveillance System (YRBSS), various years, 1993–2011.
Indicator 7: Percentage of High School Students were Overweight (various years, 1999–2011).

NOTE: 95% confidence interval. Overweight students were definedbeing >= 85th percentile but < 95th percentile for body mass index, based on sex- and age-specific reference data from the 2000 CDC growth charts.
SOURCE: Centers for Disease Control and Prevention, National Center for Chronic Disease Prevention and Health Promotion, Youth Risk Behavior Surveillance System (YRBSS), various years, 1999–2011.


