International Comparisons of Annual Labor Force Statistics, Adjusted to U.S. Concepts, 16 Countries, 1970-2011
CHARTS
|
|
More Options
- Download entire report (HTML) (PDF 3MB)
- Full series and underlying levels
- By indicator (XLS)
- By country (XLS)
|
Chart 1. Unemployment rates, 2005-2011

NOTE: For South Africa, 2005-2007 data are not available. See Table 1 for data and unemployment notes in this report for definitions.
Chart 2. Unemployment rates by sex, 2011

NOTE: See Table 2 for data and unemployment notes in this report for definitions.
Chart 3. Unemployment rates for teenagers, persons ages 20-24, and adults, 2011

NOTE: Teenagers are defined as 14-19-year-olds in Mexico; 16-19-year-olds in Canada, Spain, Sweden, the United States, and the United Kingdom; and 15-19-year-olds in other countries shown. Adults are defined as persons 25 and older. Rates for teenagers and persons ages 20-24 are not available for South Africa.
See Table 3 and Table 4 for data and unemployment notes in this report for definitions.
Chart 4. Employment-population ratios by sex, 2011
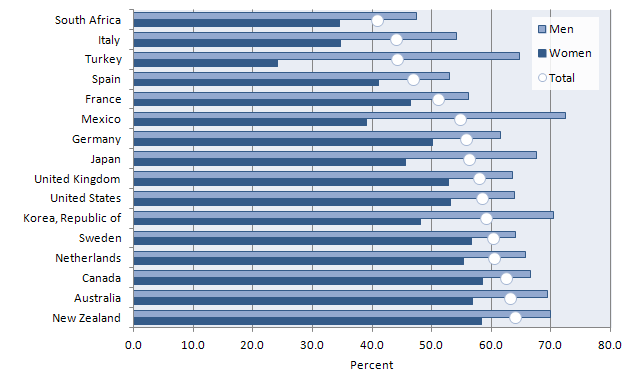
NOTE: See Table 5 and Table 6 for data and employment notes in this report for definitions.
Chart 5. Employment shares by sector, 1980 and 2011
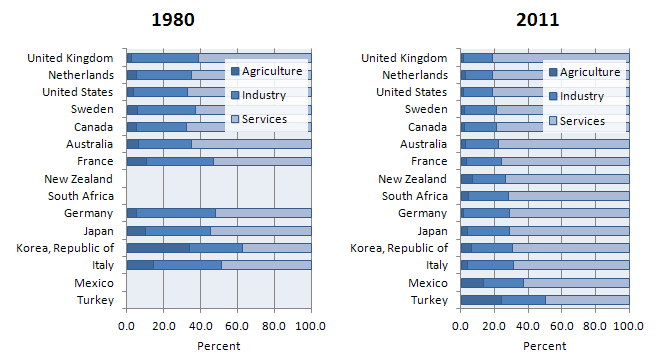
NOTE: Agriculture includes agriculture, forestry, hunting, and fishing. Industry includes manufacturing, mining, and construction. Services includes transportation, communication, public utilities, trade, finance, public administration, private household services, and miscellaneous services. 1980 data are not available for New Zealand, South Africa, Mexico, and Turkey. For Spain, BLS estimates of sectoral employment are not available.
See Table 7 for data and employment notes in this report for definitions.
Chart 6. Labor force participation rates and inactivity rates, 2011
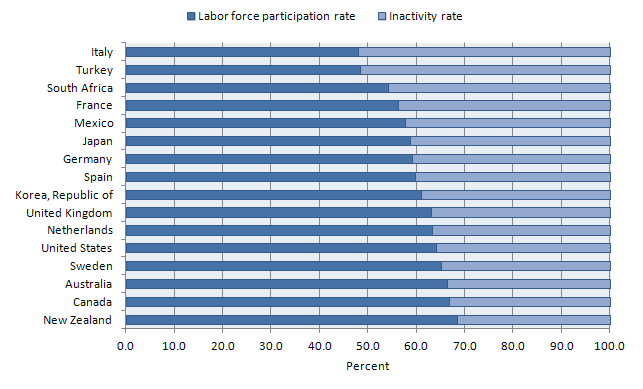
NOTE: Labor force participation rates and inactivity rates are percentages of the working-age population.
See Table 8 and Table 10 for data and labor force notes in this report for definitions.
Chart 7. Working-age population, 2011

NOTE: See Table 12 for data and working-age population notes in this report for definitions.
 Back to Top
Last Modified Date: June 7, 2012