
Abundance Surveys at the Protected Species Branch, NEFSC
Reliable quantitative information about distribution, abundance, and habitat is essential in the assessment of the status of marine mammals and the management of human impacts to these species.
Since 1991, PSB has been conducting line-transect shipboard and aerial abundance surveys over waters ranging from North Carolina to the Gulf of St. Lawrence in Nova Scotia, Canada, and from the coastline to slightly beyond the EEZ, which is 200 nautical miles offshore.
The objectives of these surveys are to: 1) estimate the most unbiased and precise abundances as possible for as many cetacean and turtle species as possible, and 2) describe the distribution and habitat preferences of as many cetacean and turtle species as possible.
To achieve the first objective we have conducted research in the development of the line-transect methodology used to estimate abundance. This has involved developing the analytical methods and conducting experimental shipboard and aerial studies. The general characteristics of the previously collected abundance surveys can be found here. The time series of the abundance estimates for cetaceans that resulted from these surveys can be found here.
To achieve the second objective we have collected data on the physical and biological habitat at the same time as we collected data on the distribution and abundance of marine mammals. This has required five teams of scientists on a typical shipboard abundance survey.
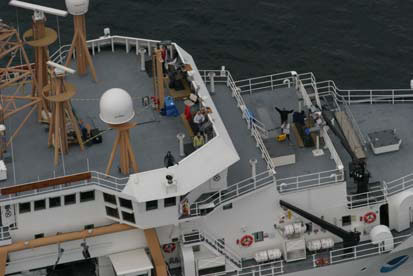
There are usually two independent teams of scientists visually scanning the waters in front of the ship either with naked eye or high powered binoculars (25x150 or 20x60 powered) in search of whales, dolphins, porpoises, seals, sea turtles and some fish species, such as sunfish, sharks, and rays. With two independent teams the line transect data can be used in a capture-recapture framework to estimate g(0), the probability of detecting a group on the track line.
. 
In addition, at times these scientists collect biopsy samples and photographs to assist in the knowledge of the species’ stock structure and to correctly identify the species that are detected during the survey.


There is a team of scientists that are dedicated to searching for seabirds that are detected using naked eye while conducting a strip-transect survey.
There is a team of scientists that record the acoustic sounds of animals that are detected from a passive acoustic hydrophone that is trailing behind the ship at the same time the visual three teams are searching for animals.


There is also a team of scientists that record the physical characteristics of the water and collect and/or record the distribution and abundance of plankton. Continuously recorded physical characteristics of the habitat include surface water temperature and water depth. In addition, at stations along the line transects, the physical and biological characteristics of the water column which are collected include water temperature, salinity, and plankton. Plankton data are collected using a bongo net or a Visual Plankton Recorder (VPR).


On a typical aerial abundance survey we use a plane, such as the NOAA Twin Otter, that has good visibility of waters to the front and below. This is achieved by having large bubble windows on the sides of the plane and a belly window that looks directly below the plane. There are often 5 scientists and 2 pilots on the plane. Of the scientists, 3 are simultaneously searching the waters for cetaceans, sea turtles, seals, and large fish, while one scientist is recording the effort and sightings information, and one scientist is resting. The scientists rotate positions so that they stay fresh and collect good quality data. Additionally, on many of the flights there is a probe that records the sea surface water temperature of the water directly below the plane. Often it is necessary to circle the groups of animals to take photographs that are used to positively identify the species or even to identify an individual animal, such as that done on the Right Whale Sighting Survey flights. More details of the procedures used to collect and analyze aerial survey abundance data can be found in the 2007 aerial survey cruise report or the document Abundance of the Gulf of Maine/Bay of Fundy harbor porpoise based on shipboard and aerial surveys during 1999.

|
www.nefsc.noaa.gov |
NMFS Search |
Link Disclaimer |
webMASTER |
Privacy Policy |
(File Modified Nov. 14 2012)
|