Hyperopia
Hyperopia Defined
Hyperopia, also known as farsightedness, is a common type of refractive error where distant objects may be seen more clearly than objects that are near. The threshold for clinically significant hyperopia is somewhat higher at 3.0 diopters or more.
On this page:
2010 U.S. Age-Specific Prevalence Rates for Hyperopia by Age, and Race/Ethnicity

| Age |
White |
Black |
Hispanic |
Other |
All |
| 40-49 |
3.94% |
2.83% |
3.12% |
3.45% |
3.65% |
| 50-54 |
6.90% |
4.40% |
5.14% |
5.57% |
6.33% |
| 55-59 |
9.60% |
5.54% |
6.87% |
7.32% |
8.76% |
| 60-64 |
12.67% |
6.61% |
8.84% |
9.24% |
11.57% |
| 65-69 |
15.95% |
7.59% |
10.97% |
11.24% |
14.55% |
| 70-74 |
19.16% |
8.37% |
13.12% |
13.17% |
17.42% |
| 75-79 |
22.03% |
9.02% |
15.11% |
15.04% |
20.15% |
| 80+ |
25.12% |
9.66% |
17.50% |
17.07% |
23.31% |
| TOTAL |
11.38% |
5.17% |
6.42% |
7.21% |
9.95% |
| Female/Age |
White |
Black |
Hispanic |
Other |
All |
| 40-49 |
4.05% |
3.29% |
2.99% |
3.57% |
3.76% |
| 50-54 |
7.41% |
5.37% |
5.38% |
6.17% |
6.86% |
| 55-59 |
10.52% |
7.06% |
7.48% |
8.36% |
9.70% |
| 60-64 |
14.05% |
8.80% |
9.93% |
10.79% |
12.97% |
| 65-69 |
17.73% |
10.52% |
12.56% |
13.37% |
16.38% |
| 70-74 |
21.20% |
11.97% |
15.19% |
15.80% |
19.55% |
| 75-79 |
24.11% |
13.01% |
17.57% |
17.89% |
22.34% |
| 80+ |
26.63% |
13.35% |
20.18% |
19.87% |
25.02% |
| TOTAL |
12.81% |
6.92% |
7.29% |
8.39% |
11.31% |
| Male/Age |
White |
Black |
Hispanic |
Other |
All |
| 40-49 |
3.83% |
2.32% |
3.23% |
3.31% |
3.52% |
| 50-54 |
6.38% |
3.30% |
4.91% |
4.89% |
5.78% |
| 55-59 |
8.64% |
3.76% |
6.21% |
6.10% |
7.76% |
| 60-64 |
11.22% |
3.93% |
7.61% |
7.39% |
10.05% |
| 65-69 |
14.00% |
3.76% |
9.05% |
8.73% |
12.50% |
| 70-74 |
16.80% |
3.30% |
10.44% |
10.01% |
14.89% |
| 75-79 |
19.42% |
2.66% |
11.69% |
11.16% |
17.30% |
| 80+ |
22.50% |
1.62% |
13.05% |
12.48% |
20.30% |
| TOTAL |
9.81% |
3.02% |
5.49% |
5.83% |
8.42% |

2010 Prevalence Rates of Hyperopia by Race

| |
All |
White |
Black |
Hispanic |
Other |
| Prevalence |
0.099 |
0.114 |
0.052 |
0.064 |
0.072 |
2010 U.S. Prevalent Cases of Hyperopia (in thousands) by Age, and Race/Ethnicity

| Age |
White |
Black |
Hispanic |
Other |
All |
| 40-49 |
1,126 |
152 |
201 |
110 |
1,589 |
| 50-54 |
1,090 |
116 |
125 |
80 |
1,411 |
| 55-59 |
1,388 |
120 |
126 |
89 |
1,723 |
| 60-64 |
1,625 |
109 |
121 |
90 |
1,945 |
| 65-69 |
1,545 |
87 |
104 |
75 |
1,811 |
| 70-74 |
1,390 |
69 |
92 |
64 |
1,615 |
| 75-79 |
1,291 |
54 |
77 |
51 |
1,473 |
| 80+ |
2,363 |
77 |
109 |
71 |
2,620 |
| TOTAL |
11,818 |
784 |
955 |
630 |
14,187 |
2010 U.S. Prevalent Cases of Hyperopia (in thousands) by Age, Gender, and Race/Ethnicity

| Female/Age |
White |
Black |
Hispanic |
Other |
All |
| 40-49 |
580 |
93 |
95 |
60 |
828 |
| 50-54 |
591 |
75 |
66 |
47 |
779 |
| 55-59 |
775 |
83 |
71 |
55 |
984 |
| 60-64 |
924 |
80 |
72 |
57 |
1,133 |
| 65-69 |
897 |
68 |
65 |
48 |
1,078 |
| 70-74 |
824 |
58 |
60 |
42 |
984 |
| 75-79 |
788 |
48 |
52 |
35 |
923 |
| 80+ |
1,588 |
73 |
78 |
51 |
1,790 |
| TOTAL |
6,967 |
578 |
559 |
395 |
8,499 |
| Male/Age |
White |
Black |
Hispanic |
Other |
All |
| 40-49 |
546 |
59 |
106 |
50 |
761 |
| 50-54 |
499 |
41 |
59 |
33 |
632 |
| 55-59 |
613 |
37 |
55 |
34 |
739 |
| 60-64 |
701 |
29 |
49 |
33 |
812 |
| 65-69 |
648 |
19 |
39 |
27 |
733 |
| 70-74 |
566 |
11 |
32 |
22 |
631 |
| 75-79 |
503 |
6 |
25 |
16 |
550 |
| 80+ |
775 |
4 |
31 |
20 |
830 |
| TOTAL |
4,851 |
206 |
396 |
235 |
5,688 |
Projections for Hyperopia (2010-2030-2050)

| Year |
All |
White |
Black |
Hispanic |
Other |
| 2010 |
14,186,819 |
11,817,068 |
784,755 |
956,761 |
628,235 |
| 2030 |
19,818,339 |
15,051,739 |
1,175,800 |
2,294,625 |
1,296,174 |
| 2050 |
23,439,671 |
15,578,153 |
1,517,249 |
4,161,914 |
2,182,356 |

| Total Population |
142,648,393 |
103,846,437 |
15,190,777 |
14,901,369 |
8,709,810 |
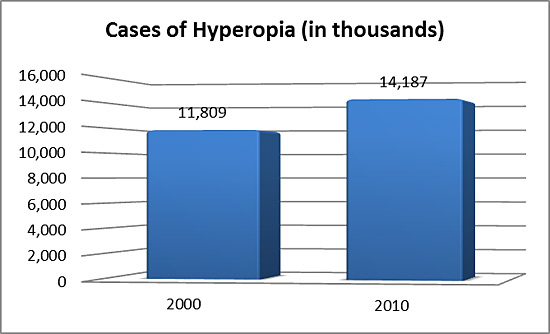
Changes of Cases between 2000 and 2010
| Year |
Value |
Short Value |
| 2000 |
11,808,911 |
11,809 |
| 2010 |
14,186,819 |
14,187 |
2000 U.S. Prevalent Cases of Hyperopia (in thousands) by Age, and Race/Ethnicity

| Age |
White |
Black |
Hispanic |
Other |
All |
| 40-49 |
1,187 |
136 |
125 |
86 |
1,534 |
| 50-54 |
925 |
78 |
70 |
53 |
1,126 |
| 55-59 |
1,011 |
72 |
66 |
50 |
1,199 |
| 60-64 |
1,079 |
70 |
66 |
48 |
1,263 |
| 65-69 |
1,228 |
67 |
66 |
47 |
1,408 |
| 70-74 |
1,412 |
62 |
62 |
44 |
1,580 |
| 75-79 |
1,397 |
49 |
50 |
35 |
1,531 |
| 80+ |
2,005 |
64 |
58 |
42 |
2,169 |
| TOTAL |
10,244 |
598 |
563 |
405 |
11,810 |
2000 U.S. Prevalent Cases of Hyperopia (in thousands) by Age, Gender, and Race/Ethnicity

| Female/Age |
White |
Black |
Hispanic |
Other |
All |
| 40-49 |
610 |
84 |
59 |
47 |
800 |
| 50-54 |
502 |
51 |
37 |
31 |
621 |
| 55-59 |
567 |
50 |
38 |
30 |
685 |
| 60-64 |
620 |
52 |
40 |
30 |
742 |
| 65-69 |
725 |
53 |
42 |
31 |
851 |
| 70-74 |
862 |
52 |
41 |
30 |
985 |
| 75-79 |
892 |
44 |
34 |
24 |
994 |
| 80+ |
1,411 |
61 |
43 |
30 |
1,545 |
| TOTAL |
6,189 |
447 |
334 |
253 |
7,223 |
| Male/Age |
White |
Black |
Hispanic |
Other |
All |
| 40-49 |
577 |
52 |
66 |
39 |
734 |
| 50-54 |
423 |
27 |
33 |
22 |
505 |
| 55-59 |
444 |
22 |
28 |
20 |
514 |
| 60-64 |
459 |
18 |
26 |
18 |
521 |
| 65-69 |
503 |
14 |
24 |
16 |
557 |
| 70-74 |
550 |
10 |
21 |
14 |
595 |
| 75-79 |
505 |
5 |
16 |
11 |
537 |
| 80+ |
594 |
3 |
15 |
12 |
624 |
| TOTAL |
4,055 |
151 |
229 |
152 |
4,587 |

