Data access options
Real-time monitoring
Non-realtime monitoring
Periodic Measurements
|
The mission of the Water Discipline, which supports the overall mission of the
U.S. Department of the Interior and the U.S. Geological Survey,
is to provide the hydrologic information and understanding needed for the best use
and management of the Nation's water resources for the benefit of the people
of the United States.
This website was originally designed as a part of a
groundwater network analysis project to select
the most-representative wells in the South Florida area. Such wells were considered
to be among the most efficient sites to instrument with telemetry.
With this website, the goal is to provide water managers with daily updates
on groundwater conditions in southern Florida. Many of the analytical tools used
to select the representative monitoring wells are also employed to analyze data
for this website. The site incorporates image maps showing current conditions for
stations in selected geographical areas and aquifers, and statistical comparison
plots for each station. The maps can also be used to navigate the site to the
pages specific to the stations displayed.
| |
|---|
Current Water-level Conditions in South Florida
|
|
The stations presented in these web pages are continuously monitored by on-site
equipment. The data collected are held on-site until transferred by satellite to
USGS computers. These data transfers are scheduled every 4 hours. Considering
transfer and analysis time, the data on this page are expected to be current to
the date and may be updated more frequently as conditions require. The data
presented are provisional,
as they are retrieved directly from the USGS database without final quality
assurance/quality control review.
For more information on the methods used and the data analyzed,
the project report is available on this website.
A PDF version of the report
(download 6.3 MB)
is also available.
- URL:
http://www.sflorida.er.usgs.gov/ddn_data/index.html
Current Water-level Conditions in South Florida (de-trended) - The data presented in
the image maps are the 7-day averages of the daily values (daily maximum water level
for ground water in South Florida) as compared to the historical (the last 25 years,
as avilable) data from each station. As discussed above, the historical data
have been analyzed to determine the existence and extent of any long-term
trends. Long-term trends are mathematically removed from the data in order to
present current data in a historical context without the skewing caused by
such trends.
- URL:
http://www.sflorida.er.usgs.gov/ddn_data/index_ndt.html
Current Water-level Conditions in South Florida (without trend removal) - The data presented in
the image maps are the 7-day averages of the daily values (daily maximum water level
for ground water in South Florida) as compared to the historical (the last 25 years,
as avilable) data from each station. In these pages, long-term trends are not
considered. Plots of current data against the distribution of historical data may
therefore show current water levels abnormally low during a period of good water
supply or abnormally high during a drought in cases where there is a long-term
downward or upward trend in water levels.
|

|
End-of-Month Water-level Conditions in South Florida
|
|
Prior to September 2000, the FISC-WRS produced an End-of-Month
(EOM) report
summarizing water-level information throughout South Florida. The majority of these wells
were not monitored in real-time via
satellite telemetry, so this was the primary method of disseminating the provisional
data from these sites to regional water managers. Because of the widespread availability
of the World Wide Web (WWW), this site has replaced the EOM report.
The stations presented in these WWW pages are continuously monitored by on-site
equipment. The data collected are held on-site until downloaded by a USGS technician
during a monthly site visit. These visits are scheduled every 4-8 weeks, based on
operational requirements, and so the data on this page are only generally expected
to be current up to the second month before the current month. In any case, the data
presented are provisional, as they are retrieved
directly from the USGS database without final quality assurance/quality control review.
- URL:
http://www.sflorida.er.usgs.gov/edl_data/index.html
Water-level Conditions for the End of <Month> in South Florida (de-trended) -
As with the
real-time pages,
the historical data (last 25 years, as available) from each well has been analyzed to determine
if there is a long-term trend in the data. At sites where there has been a long-term change in
water levels, the long-term trend is mathematically removed from the data in order to
present current data in a historical context without the skewing caused by a long-term trend.
- URL:
http://www.sflorida.er.usgs.gov/edl_data/index_ndt.html
Water-level Conditions for the End of <Month> in South Florida (without trend removal) -
The data presented in
the image maps are the 7-day averages of the daily values (daily maximum water level
for ground water in South Florida) as compared to the historical (the last 25 years,
as avilable) data from each station. In these pages, long-term trends are not
considered. Plots of current data against the distribution of historical data may
therefore show current water levels abnormally low during a period of good water
supply or abnormally high during a drought in cases where there is a long-term
downward or upward trend in water levels.
|

|
Manual Water-Level Measurements in South Florida
|
- URL:
http://www.sflorida.er.usgs.gov/edl_data/index_qw.html
With the development of websites to display data from
real-time and non-real-time,
continuously-monitored groundwater stations, it was decided that the
FISC-WRS should also produce a site
displaying data from periodically-measured groundwater sites.
By this time NWISWeb was able
to provide periodic groundwater levels
as well as water quality parameters,
neither are presented with a historical analysis of the data. This site is intended
to fill the gap between the existing analytical sites provided by FISC-WRS and the
historical measurements data avilable through NWISWeb.
The stations presented in these WWW pages are periodically
(generally monthly, quarterly, biannually, or annually) visited for the purpose of
collecting manual tapedown
(measurement of water level) or chloride concentration data. In some cases,
these stations are also continuously monitored for groundwater elevation at the
sites. This will be noted on the station page and such sites should also be
available on the real-time
and non-real-time pages. For the majority
of the remaining sites, the data on this page are only generally expected
to be current up to the second month before the current month. Also, such sites
will include two-year duration plots of the most recent data compared to the
historical average water level calculated for the site. In any case, the data
presented are provisional,
as they are retrieved directly from the USGS database
without final quality assurance/quality control review.
|

|
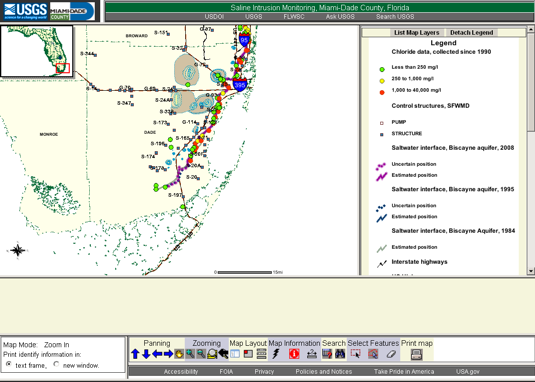
Saline Intrusion Monitoring, Miami-Dade County, Florida
|
|
This internet map service has been developed as a part of a larger study
investigating both the current extent of seawater encroachment into
the Biscayne Aquifer and the hydrogeologic context in which intrusion
may be occurring. The study area itself includes most of metropolitan
Miami-Dade County, Florida.
- URL:
http://www.envirobase.usgs.gov/FLIMS/SaltFront/
Saline Intrusion Monitoring, Miami-Dade County, Florida -
This portal has the following goals:
- provide access to all of the salinity information collected as part of this project,
- provide access to data being collected from the modified USGS / Miami-Dade County monitoring network as it evolves,
- provide a resource for integrating the geographic data sets from other researchers and agencies working in the area, and
- provide an improved means of evaluating salinity changes in the Biscayne Aquifer that will occur even after the project has been completed.
Because an internet map service is not entirely accessible to the public under various
conditions, accessible support to this site is available through:
Salinity and Chloride Data, Sites in Miami-Dade County, Florida, a sub-page of Salinity and Chloride Data, South Florida. Access to chloride data collected by Florida Keys Aqueduct Authority that were used in the estimation of the 2008 inland extent of saltwater intrusion in Miami-Dade County, FL can be located through the Hydrographic Internet Map Service Data Library.
- URL:
http://www.sflorida.er.usgs.gov/sal_data/index.html
Salinity and Chloride Data, South Florida -
As discussed, this site has been developed as an extension of the existing
map-based data access pages. Because there is concern that interactive map technologies,
such as ArcIMS, are not fully accessible to many citizens, the infrastructure on which the
preceding sites were built has been retained. Because of the shared architecture
with the groundwater conditions sites, the study area for this website includes
the southwest coastal areas and more of the southeast coastal areas
of peninsular Florida than the Miami-Dade County study are of the ArcIMS portal.
|

|
Other Hydrologic Monitoring Sites of Interest
- South Florida
- Everglades Depth Estimation Network (EDEN, (USGS))
- South Florida Information Access (USGS)
- Southwest Florida Hydrologic Data Web Portal (USGS)
- USGS South Florida Coastal Stations
- Weather and Water(South Florida Water Management District)
- Florida state and regional sites
- USGS Real-Time Water Data for Florida (USGS)
- Florida Climate Center (Office of State Climatologist)
- Real Time Satellite Fire Monitoring - Florida (National Oceanic and Atmospheric Administration)
- National sites
- Ground Water Climate Response Network (USGS. Some pages may not display in all browsers)
- National Water Conditions - Historical Maps of Monthly and Annual Streamflow Conditions by Water Year (USGS)
- Palmer Drought Severity Index (National Oceanic and Atmospheric Administration)
- U.S. Drought Monitor (National Drought Mitigation Center)
- U.S. Palmer Drought Indices (National Oceanic and Atmospheric Administration)
- USGS Water Data for the Nation
- WaterWatch -- Current water resources conditions (USGS)
|
Florida Weather
|
|