Kansas Water Science Center
Publications
Highlights

Kansas Drought WatchDroughts affect more people in North America than any other natural hazard. The cost of losses due to drought in the United States averages $8-9 billion every year. In Kansas, the droughts of the 1930s and 1950s resulted in severe economic impacts that included crop losses and damage, high livestock mortality rates, tree loss due to disease, damage to fish habitat due to low streamflows, and increased food prices. Low streamflows during 2000-2006 in Kansas resulted in record low levels at Federal reservoirs and an unprecedented number of administrative decisions made by Kansas Department of Agriculture, Division of Water Resources to curtail water diversions from rivers to maintain State minimum desirable streamflows. In 2006, communities that receive their municipal water supply from alluvial wells connected to the Smoky Hill River experienced water shortages because of low streamflows. Included in this page are tables and maps that summarize drought conditions in Kansas using real-time data from USGS streamgages and publications that describe historical droughts in Kansas.  on July 26, 2012. Photo by Andrew Clark, USGS.")
 on July 26, 2012. Photo by Andrew Clark, USGS.")
 on July 17, 2012. Photo by Nathan Sullivan, USGS.")
 on July 20, 2012. Photo by Mark Lysaught, USGS.")
 on July 9, 2012. Photo by Anita Kroska, USGS.")
 on July 23, 2012. Photo by Mark Lysaught, USGS.")
 on July 24, 2012. Photo by Anita Kroska, USGS.")
 on July 17, 2012. Phot by Travis See, USGS.")
 on July 16, 2012. Photo by Sonja McDanel, USGS.")
 on July 13, 2012. Photo by Carl Collins, USGS.")
 on Aug. 3, 2012. Photo by Mike Holt, USGS.")
 on July 23, 2012. Photo by Duane Wilmes, USGS.")
Drought Information and Publications
For additional information:
U.S. Geological Survey 4821 Quail Crest Place Lawrence, Kansas 66049-3839 Phone (785) 832-3516 email: bloving@usgs.gov Map of below normal 7-day average streamflow compared to historical streamflow for the day of the year
The "below normal 7-day average streamflow" map shows the average streamflow conditions for the past 7 days. By averaging over 7 days, the values on the map are more indicative of longer-term streamflow conditions than either the "Real-time streamflow" or the "Daily streamflow" maps. The map depicts below normal 7-day average streamflow conditions as computed at USGS streamgages. The colors represent below normal 7-day average streamflow compared to percentiles of historical below normal 7-day average streamflow for the day of the year. This map represents conditions adjusted for this time of the year. Only streamgages having at least 30 years of record are used. States containing no dots indicate locations where flow data for the current day are temporarily unavailable. During winter months, some states (or parts of states) may have fewer dots than at other times of the year due to ice effects. Kansas Drought Maps, Graphs, and Tables |

![]() U.S. Department of the Interior |
U.S. Geological Survey
U.S. Department of the Interior |
U.S. Geological Survey
URL: /waterwatch/drought/index.shtml
Page Contact Information: GS-W-KS_info@usgs.gov
Page Last Modified:Thursday, 13-Dec-2012 09:11:24 CST

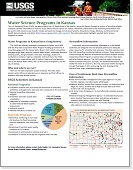 The USGS has collected hydrologic information in Kansas since 1895 with the first USGS Cooperative
Water Program funding agreement for 6 streamflow gages with the Kansas Water Board. USGS collects streamflow
and gage-height data; reservoir content; water-quality and water-quantity data; suspended-sediment data;
and groundwater levels. Hydrologic studies are conducted on national, regional, statewide, and local levels.
The USGS in Kansas works cooperatively with 31 Federal, State, and local agencies, such as the Kansas Water Office, the U.S.Army Corps of Engineers, and the City of Wichita
The USGS has collected hydrologic information in Kansas since 1895 with the first USGS Cooperative
Water Program funding agreement for 6 streamflow gages with the Kansas Water Board. USGS collects streamflow
and gage-height data; reservoir content; water-quality and water-quantity data; suspended-sediment data;
and groundwater levels. Hydrologic studies are conducted on national, regional, statewide, and local levels.
The USGS in Kansas works cooperatively with 31 Federal, State, and local agencies, such as the Kansas Water Office, the U.S.Army Corps of Engineers, and the City of Wichita