
Education, Outreach and Training

One stop location for formal and informal education, training and outreach materials that use ocean observing information about physical, chemical, geological, and biological changes in our oceans, coasts, and Great Lakes.
New: Training Resources
Training resources aim to help users understand what ocean observations data and information is available on websites and mobile devices and how to use them.
Regional Education Websites

Kasitsna Bay Earth Workshop, 2011 -
20 teachers focused on developing curriculum for the Gulf of Alaska. The workshop was in partnership with COSEE Alaska, the North Pacific Research Board, the Monterrey Bay Aquarium and Research Institute, and AOOS.
Alaska (AOOS)
- Alaska Centers for Ocean Sciences Education Excellence
- The EARTH program uses near-real-time data from ocean observatories to design and test outreach with the Internet as an interface to scientists, teachers, students, and the public
- Training for Coastal Managers, climate change, coastal communities, coastal processes, data products
Caribbean (CariCOOS)
- The CariCOOS Education section provides data visualization of waves, winds, currents, water quality and coastal flooding in real time to the various users of coastal waters such as recreational and commercial fishermen, surfers, swimmers, sailors, students, researchers, government regulatory agencies, and emergency management agencies, among others.
(top)
Central and Northern California (CeNCOOS)
- The CeNCOOS Classroom provides educational products for people of all ages to learn about CeNCOOS and topics related to ocean observing in the region.
Gulf of Mexico (GCOOS)
- Gulf of Mexico Coastal Ocean Observing System Education and Outreach offers formal and informal education resources centered around ocean and weather information for the Gulf Coast – from Florida to Texas.
Great Lakes (GLOS)
- Teaching with Great Lakes Data - Great Lakes lessons and activities, data sets and tools.
Mid-Atlantic (MARACOOS)
- MARACOOS Education seeks to educate users on end product delivery and understanding. Through workshops, programs, studies, pilot projects and collaborations, MARACOOS hopes to educate the many users of ocean observation data.
(top)
Northwest Pacific (NANOOS)
- Learning tools, lesson plans and links to marine resources for teachers and students
Northeastern Atlantic (NERACOOS)
Pacific Islands (PacIOOS)
Southeastern California (SCCOOS)
- What is an ocean observing system: surface current mapping, metereological stations, automated shore stations, manual shore stations, and more. Teacher resources, professional development, real time data in the classroom and more.
Southeast Atlantic (SECOORA)
- K-12 resources based on ocean observations, lesson plans, and real-time data: this website is for ocean users, teachers, and other educators to learn how ocean observing information can be used or incorporated into classroom and other educational programs.
(top)
Lesson Plans
These lesson plans present ocean observing science through activities using ocean observing information.
Virtual Wave Classroom
Get the "Making Waves" poster, find lessons, locate real-time wave information on the web, learn the wave vocabulary with the waves glossary, and more.
COSEE Southeast and COSEE Gulf of Mexico are SECOORA education partners in developing these materials.
Home, Home on the Beach
Grades: 5-8, 9-12
NSES: B,D,E,G
Tags: ecosystems, water quality
Investigate the effects of storm wave action on man made structures on a beach or island and determine the best place to build an ocean front structure on an island
http://secoora.org/classroom/virtual_wave/home_on_the_beach
Making Waves
Grades: 5-8, 9-12
NSES: A, B, G
Tags: ecosystems, water quality
Investigate the effects of waves on beaches and the differences between summer and winter waves.
http://secoora.org/classroom/virtual_wave/making_waves
Wind Waves
Grades: K-4, 5-8, 9-12
NSES: A, B, G
Tags: ecosystems, water quality
Investigate the effects of storm wave action on man made structures on a beach or island and determine the best place to build an ocean front structure on an island.
http://secoora.org/classroom/virtual_wave/wind_waves
(top)
Wave Size and Depth
Grades: 5-8, 9-12
NSES: A, B, G
Tags: ecosystems, water quality
Investigate the relationship between the size of a wave and the depth to which the effects of its energy can be observed.
http://secoora.org/classroom/virtual_wave/wave_size_depth
Forecasting Conditions at Sea
Conditions at Sea: Background
Subject: Earth/Physical Science
Grade: 6-12
Forecasting conditions at sea is an important tool for sailors, fishers, maritime transportation, and anyone on the water. In Conditions at Sea, a three-part series, students first learn about the concepts of wave formation and forecasting, conduct an in-class wave-making activity, and access near real-time and real-time data from ocean observing buoys to investigate the relationship between wind and wave height, and to predict actual conditions at sea using the Beaufort scale.
http://www.nanoos.org/education/lesson_plans/pdfs/conditions_at_sea-background.pdf
Ocean Observation
Subject: Earth/Physical Science
Grade: 6-12
Tags: Technology
This activity will familiarize students with methods scientists use to study the coastal ocean in the Pacific Northwest, and will encourage them to pose and investigate their own questions about the ocean.
http://www.nanoos.org/education/lesson_plans/pdfs/ocean_observation_090115.pdf
Satellite Tracking
Subject: Earth/Biology Science
Grade: 9-12
Tags: Technology, Ecosystems, Water Quality
Students use satellite tagging data to follow the movement of marine animals over time. Examining satellite maps of Sea Surface Temperature (SST) and chlorophyll-a data, combined with satellite tagging data, students answer questions related to open-ocean animals, their habitats and migratory behaviors.
http://www.nanoos.org/education/lesson_plans/pdfs/satellite_tracking_090116.pdf
(top)
Water Column Profiles
Subject: Earth/Biology Science
Tags: Technology, Ecosystems, Water Quality
Students access and retrieve water column profile data from NANOOS and the WA Department of Ecology's Marine Water Monitoring database. Using this data, students construct water column profiles and provide plausible explanations for why the profile looks as it does.
http://www.nanoos.org/education/lesson_plans/pdfs/water_column_profiles.pdf
Well, Well, Well
Subject: Earth/Biology Science
Tags: Technology, Ecosystems, Water Quality, upwelling, downwelling
Students investigate the relationship between winds, surface currents, sea surface temperature and upwelling and downwelling off the coast of OR and WA. Students analyze data to make predictions on today's upwelling or downwelling conditions.
http://www.nanoos.org/education/lesson_plans/pdfs/well_well_well.pdf
Virtual Hurricanes
Take your students by storm using the SECOORA virtual hurricane classroom – featuring an “eye”-catching poster, hurricane information and activity websites, a hurricane glossary, and classroom activities.
http://secoora.org/classroom/virtual_hurricane
Storm Surges, Great Lakes Climate and Weather, Dead Zones, and Fish Finders
Subject: Earth/Biology Science
Tags: Technology, Ecosystems, Water Quality
(top)
Using Real Data
The integration of real world data into classroom instruction is a powerful means to increase student interest and understanding of concepts. The U.S. Integrated Ocean Observing System provides this real observation data for use in education.
Satellite Tracking
Grades: 9-12
Tags: ecosystems, water quality
Students use satellite tagging data to follow the movement of marine animals over time. Examining satellite maps of sea Surface Temperature (SST) and chlorophyll-a data combined with satellite tagging data, students answer questions related to open-ocean animals, their habitats and migratory behaviors.
This is a free 3-week online workshop offered by COSEE-West and the College of Exploration. Graduate credit is available for this workshop.
http://www.nanoos.org/education/lesson_plans/pdfs/satellite_tracking_090116.pdf
Conditions at Sea
Grades: 6-12
Tags: ecosystems, water quality, technology
Forecasting conditions at sea is an important tool for sailors, fishers, maritime transportation, and anyone on the water. In Conditions at Sea, a three-part series, students first learn about the concepts of wave formation and forecasting, conduct an in-class wave-making activity, and access near real-time and real-time data from ocean observing buoys to investigate the relationship between wind and wave height, and to predict actual conditions at sea using the Beaufort scale.
http://www.nanoos.org/education/lesson_plans/pdfs/conditions_at_sea-data_activity.pdf
Water Column Profiles
Grades: 6-12
Tags: ecosystems, water quality, technology
Students access and retrieve water column profile data from NANOOS and the WA Department of Ecology's Marine Water Monitoring database. Using this data, students construct water column profiles and provide plausible explanations for why the profile looks as it does.
http://www.nanoos.org/education/lesson_plans/pdfs/water_column_profiles.pdf
(top)
Well, Well, Well
Grades: 6-12
Tags: ecosystems, water quality, technology, upwelling, downwelling
Students investigate the relationship between winds, surface currents, sea surface temperature, and upwelling and downwelling off the coast of OR and WA. Students analyze data to make predictions on today's upwelling or downwelling conditions.
http://www.nanoos.org/education/learning_tools/lobo/lobo_exhibit.php
Interactive Computer Exhibit
Grades: 6-12
Tags: ecosystems, water quality
Check out what happens to salinity, or the amount of salt in the water, in an estuary located in Newport, OR. This exhibit is physically located in the Hatfield Marine Science Center Visitors Center and was created to help you, the general public, make sense of what is happening in the bays and estuaries in the Pacific Northwest.
http://www.nanoos.org/education/learning_tools/lobo/lobo_exhibit.php
(top)
Multimedia, Apps and Social Media
Multimedia
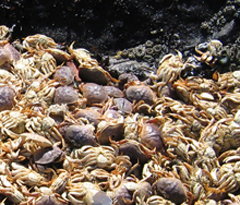
Fish and crab kills in the Puget Sound and the Oregon coast shelf, Pacific Northwest Ocean Observing, NANOOS
Educators Interview Marine Scientists
Eight scientists at the University of South Florida, a SECOORA member, discuss their work and studies in the marine sciences.
http://secoora.org/classroom/observing_overview/
educators_interview_scientists
Animations about coastal and estuarine hypoxia,
and the resulting dead zones, in the Pacific Northwest.
Find out what scientists have already learned about seasonal dead zones and explore some data to see if hypoxia events are currently creating dead zones off the coast of Oregon and in the Hood Canal in Washington.
http://www.nanoos.org/education/
learning_tools/hypoxia/introduction.php
Dramatic Changes in Alaska's Marine Ecosystems
Three short videos showcase the dramatic changes in Alaska's marine ecosystems through interviews with scientists and Alaska Natives. These podcasts include interviews with Alaska Natives, commentary by scientists, and footage from Alaska's Arctic.
http://www.aoos.org/faces-of-climate-change/
(top)
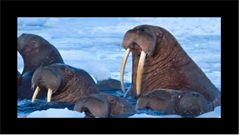
Faces of Climate Change, Alaska Ocean Observing, AOOS
Check out What Happens to Salinity in an Estuary
Interactive computer exhibit. Check out what happens to salinity, or the amount of salt in the water, in an estuary located in Newport, OR. This exhibit is physically located in the Hatfield Marine Science Center Visitors Center and was created to help you, the general public, make sense of what is happening in the bays and estuaries in the Pacific Northwest.
http://www.nanoos.org/education/learning_tools/
lobo/lobo_exhibit.php
Ocean Literacy Principles Animation
In 2004, ocean educators from across the country gathered to discuss ways to increase the awareness and knowledge of the general public concerning ocean issues. In essence, they asked the question “what does it mean to be "ocean literate"? As a result of this workshop, the Ocean Literacy Initiative was born. Over the next few years, teams of scientists and educators developed a list of “seven essential principles” that everyone should know about the ocean. This effort has helped ocean educators focus their message and concentrate on ways to bring a basic level of ocean understanding to all audiences.
http://coseenow.net/blog/ocean-literacy-interactive-animation/
Eutrophication Animation
Eutrophication is becoming an increasing problem in many coastal regions of the world ocean. It is the process in which high nutrient run-off from land can lead to low-oxygen water environments. But it’s not a very easy concept to understand, as there are several steps in the process.
http://coseenow.net/blog/eutrophication-animation/
Seasons of the Sea: Seasonal Changes in the Gulf of Maine
Seasons of the Sea invites you in with a fun mini-movie that teaches about the seasonal changes in the Gulf of Maine, as seen through the eyes of children. At the My Buoy Observations station you can record live data from buoys located in the Gulf of Maine, then post your results for others to see. This URL links to an article about the exhibit:
http://www.seacoastsciencecenter.org/about/news/detail.php?news_id=30
(top)
APPs
NVS - NANOOS Visualization System.
Apple-platform application
NANOOS Visualization System (NVS) is a tool for accessing data for the Pacfic Northwest waters from a variety of sources. NVS displays the current data values along with plots for ocean observing assets. NANOOS is a regional member of the U.S. IOOS program office.
http://itunes.apple.com/us/app/nvs/id373563865?mt=8
Android-platform application
NANOOS Visualization System (NVS) is a tool for accessing data for the Pacfic Northwest waters from a variety of sources. NVS displays the current data values along with plots for ocean observing assets. NANOOS is a regional member of the U.S. IOOS program office.
https://market.android.com/details?id=org.nanoos.nvs_android&feature=search_result
(top)
Social Media
Facebook
NANOOS: https://www.facebook.com/NANOOS.PNW
SECOORA: http://www.facebook.com/pages/Secoora/132717610106637
PacIOOS: http://www.facebook.com/pages/PacIOOS/129840997072598
NERACOOS: http://www.facebook.com/pages/NERACOOS/212012315660
Twitter
SECOORA: http://twitter.com/secoora
Outreach and Communication Resources
Flyers, fact sheets, brochures, messaging materials, and press releases
Events
IOOS Participates in the National Marine Educators Association (NMEA) Conference, June 2012
Eyes on the Ocean: Resources for educators from the Integrated Ocean Observing
System
Incorporating ocean data into your curriculum can bring real-world authenticity and excitement to your classroom or learning center.
In this presentation three educators from our regional associations of our national Integrated Ocean Observing Systems (IOOS) will share a framework for teaching with data. We will also demonstrate particular data products of interest to educators from regional observing systems in Alaska, the mid Atlantic and the Pacific Northwest.