Note: Data in this report are compiled from preliminary statistics
Updated May 24, 2010
PDF Version of this Report
The purpose of this special report is to provide documentation, data anlysis, and a preliminary understanding of large-scale climate patterns and their effects on regional weather events. In climatological terms, the Cold Season lasts from October through March. The 2009/2010 Cold Season for North America was historically active and powerful. Extreme fluctuations in temperature and precipitation in the mid-latitudes during this period can be attributed to a wide variety of rapidly progressing weather systems. The persistent systems were influenced by larger scale patterns. The strong warm phase of the El Niño–Southern Oscillation (ENSO) helped to alleviate moderate to exceptional drought across the contiguous United States. Meanwhile, the record-setting negative phase of the Arctic Oscillation produced record cold temperatures in the Deep South. During the October–March period, the contiguous U.S. experienced its eighth wettest such period, while the average temperature was below average (36th coolest). The anomalously cold air, coupled with copious amounts of moisture produced historical snowfall amounts that bested monthly and seasonal records across the country. While the overall drought footprint was at its lowest in the last decade, the moisture surplus caused flooding in the Upper Midwest and New England. High amplitude flow patterns helped the cold arctic air remain entrenched for days and weeks, devastating mild climate crops. The extreme winter of 1977/1978 was similar, as a moderate warm phase of ENSO coincided with a strong negative phase of the Arctic Oscillation. The effects of large-scale climate patterns are often influential on regional weather events and when they are extreme and historic in nature, their local effects are profound and far reaching.
The Climate Extremes Index (CEI) can be used to quantify observed changes in climate throughout time. The Cold Season (October–March) CEI for 2009/2010 was approximately six percent above average. Indicators used to calculate the Cold Season CEI include above and below normal maximum and minimum temperatures, above and below normal precipitation, and drought severity based on the Palmer Drought Serverity Index (PDSI). Contributing factors to the Cold Season CEI were unusually cool maximum temperatures, wet conditions across a large portion of the country, and an above average number of days with precipitation during the period.
| Month | Record Coldest | Record Warmest |
|---|---|---|
| October | 5324 | 616 |
| November | 97 | 676 |
| December | 1090 | 164 |
| January | 1139 | 209 |
| February | 702 | 55 |
| March | 480 | 536 |
| Month | Record Coldest | Record Warmest |
|---|---|---|
| October | 1344 | 1118 |
| November | 94 | 854 |
| December | 784 | 244 |
| January | 647 | 639 |
| February | 263 | 184 |
| March | 230 | 673 |
| Month | Record Daily | Record Monthly |
|---|---|---|
| October | 5118 | 202 |
| November | 1784 | 117 |
| December | 4134 | 147 |
| January | 3179 | 200 |
| February | 2218 | 100 |
| March | 2643 | 96 |
Note: Data in these tables were obtained from a combination of Cooperative and Automated Surface Stations.
Access NCDC U.S. Records
During the 2009/2010 Cold Season, two major global-scale climate events—El Niño and a negative Arctic Oscillation—were occurring simultaneously. The combination of their atmospheric influences brought several unusual temperature and precipitation patterns to the U.S.
The El Niño–Southern Oscillation (ENSO) is a periodic fluctuation in sea surface temperature (El Niño) and the air pressure of the overlying atmosphere (Southern Oscillation) across the equatorial Pacific Ocean. The presence of an El Niño—warm sea surface temperature anomalies in that region—sufficiently modifies the general flow of the atmosphere to affect normal weather conditions in many parts of the world, including the U.S.
During the winter, El Niño effects in the U.S. are generally characterized by mild temperatures over western Canada and parts of the northern United States and colder-than-average temperatures in the Southeast. Wetter-than-normal conditions are common in southern Alaska, from southern California eastward into Texas, and over the southern and southeastern U.S. Below-average precipitation is typical for Hawaii as well as the Pacific Northwest, extending far into Canada.
El Niño was present throughout the 2009/2010 cold season. Oceanic Niño Index (ONI) values in the Niño 3.4 region—a measure of the presence and strength of El Niño that is calculated based on a three-month running average—increased each month from October to January. The Niño 3.4 region is critically important in determining major shifts in the pattern of tropical rainfall, which influence the jet streams and patterns of temperature and precipitation around the world. ONI values began to decline in January and El Niño weakened to moderate strength by March. Warm sea surface temperature anomalies during this winter El Niño episode were the highest since the 1997/1998 winter season and the fifth highest since Climate Prediction Center records began in 1950. Generally, the greater the anomaly, the more influence El Niño has over global weather patterns.
The Arctic Oscillation (AO) is an important climate pattern that influences winter weather in the Northern Hemisphere. The oscillation exhibits a "negative phase" with relatively high pressure over the Arctic region and low pressure at mid-latitudes (around 45°N). This negative phase allows chilly Arctic air to slide south while warmer air moves north. In addition, the circulation pattern typically brings drier conditions to Alaska and wetter conditions to the western U.S. The AO is highly correlated with the North Atlantic Oscillation (NAO), which is a pressure oscillation between the Subpolar (Icelandic) Low and the Subtropical (Azores) High that controls the strength and direction of westerly winds and storm tracks across the North Atlantic. The NAO and AO are basically different ways of characterizing the same atmospheric phenomenon.

The AO, which is calculated on a monthly basis, was negative in October, with an index value of -1.54. During this month, the average temperature for the U.S. was 51.2°F (10.7°C), which was 3.6°F (2.0°C) below the 20th century average—ranking as the fourth coolest October based on the 1895–2009 period of record. Florida was the only state to have an above-normal temperature average in October.
The AO was positive in November, resulting in the third warmest November for the 1895–2009 period of record, but moved into a strong negative phase in December and remained strongly negative through January and February. The February 2010 AO index value of -4.266 was the largest negative anomaly since Climate Prediction Center records began in 1950, while the December 2009 value of -3.413 was the third largest negative anomaly (January 1977 was the second largest with a value of -3.767). The AO moderated in March, although it was still negative with an index value of -0.432. It is interesting to note that the ONI and negative AO Index eached maximized during roughly the same time period during this Cold Season.
For a more technical description of several of these patterns, please refer to:
L'Heureux, M., A. Butler, B. Jha, A. Kumar, and W. Wang (2010), Unusual extremes in the negative phase of the Arctic Oscillation during 2009, Geophys. Res. Lett., 37, L10704, doi:10.1029/2010GL043338.Characteristic El Niño precipitation patterns were evident throughout the 2009/2010 Cold Season, as reflected by changes in the U.S. Drought Monitor (USDM). During this time period, the percentage of the contiguous U.S. experiencing drought or abnormally dry conditions decreased from 36 percent (September 29th) to 27 percent (March 30th) as drought was alleviated in many areas, particularly along the West Coast, across the South, Southeast, and northern Wisconsin; however, dryness increased over parts of the Northwest.
A persistant sub-tropical jet stream provided moisture along the southern United States. In the East, the storm systems hitched a ride with the polar jet stream which dove deep into the South. This ubiquitous storm track created abnormally wet conditions along the Atlantic seaboard. The October–March period delivered much above normal precipitation to large portions of the eastern U.S. Delaware, Rhode Island, and New Jersey each recorded their wettest such period. A total of 20 states had their top ten wettest Cold Seasons for the 115-year period of record.
During October, several low pressure systems and weather fronts moved across the country in the upper-level westerly flow and widespread precipitation was prevalent across the U.S. Drought conditions were mitigated in many areas as the contiguous U.S. as a whole recorded its wettest October on record. Average precipiation was approximately double the long-term mean as 44 percent of the U.S. was categorized as "very wet". While November precipitation was much below normal, several large storm systems in December brought heavy precipitation to the eastern half of the country, making this area completely drought-free and resulting in the fifth wettest December for the contiguous U.S. on record. Regionally, the Southeast experienced its wettest December on record. The three-month (October–December) precipitation ranked as the second wettest in 115 years, behind October–December 1983. On a statewide level, Delaware, Maryland, Virginia, South Carolina, Georgia, and Alabama all experienced their wettest October–December period.
A series of winter storms generated by the subtropical jet and polar jet dominated the weather pattern for the remainder of the Cold Season. The subtropical jet channeled Pacific low pressure systems into the West and developed new low pressure systems along the Gulf Coast states. The lows picked up abundant moisture from the Gulf of Mexico and intensified as they moved east and up the Atlantic Coast. Dryness was persistent in Michigan, which experienced its driest ever January–March period. Conversely, Rhode Island and Massachusetts each had their wettest such period. Beneficial rain and snow in January shrank drought to its smallest national footprint in the last decade. According to the USDM, only 7.8 percent of the contiguous U.S. experienced drought conditions near the beginning of February. Texas experienced its 11th wettest February since records began in 1895, putting an end to its drought, which began in November 2007. Precipitation was well above normal in the Southwest; however, drought conditions expanded across most of Wyoming and eastern Colorado, and other mountain locations in the northern West, inhibiting annual snowpack levels.
Winter and spring mountain snowpack provide a crucial water source across much of the western United States. The total annual water budget for agriculture and human use in the mountainous West is based upon the amount of snow melt that will occur in spring and is proportional to the amount of snow on the ground. The annual snowpack typically reaches its maximum values at the end of March. During the 2009/2010 Cold Season, the West generally experienced much below average snowpacks. Mountain snowpack in the Pacific Northwest was less than 25 percent of normal in several locations. The pattern was evident in the high-elevation station (SNOTEL) network, especially in maps of the end-of-March snowpack and snow water content. Some individual SNOTEL stations in the northern Rockies had early April snow water equivalent in the driest fifth percentile of the historical record (95 percent of the years for this date were wetter). Conversely, the snowpack was much above average in Arizona, New Mexico, and southern Utah. A warm and dry Northwest and wet Southwest is consistent with typical El Niño conditions during the Cold Season.
Moderate to strong El Niño conditions suppressed winter storms which usually bring rain to Hawaii, creating dry conditions across the state. In December, continuing severe-to-extreme drought conditions across portions of Hawaii prompted the U.S. Department of Agriculture to declare parts of the islands a disaster area due to crop losses. By the end of February, either abnormally dry conditions (23 percent) or some stage of drought (77 percent) afflicted nearly all of Hawaii's land cover. At the beginning of March, part of the northern portion of the Big Island moved into exceptional drought for the first time since the inception of the USDM in 1999. As El Niño conditions moderated throughout the month, only 57 percent of the state had drought conditions by the end of the cool season, but the area experiencing extreme to exceptional drought expanded from 16 percent to 28 percent.
Drier-than-normal weather dominated most of Alaska throughout the Cold Season. Drought conditions grew during December and January. Snowpack in the Koyukuk Basin was reported to be 50 percent of normal. Precipitation for the hydrologic year (October to the following September) to date was especially dry. The end-of-March snowpack was below normal for the entire state, except for the southern coastal regions. This precipitation pattern is representative of typical El Niño conditions.
The 2009/2010 Cold Season was one of extremes for the contiguous U.S. with respect to temperature. Temperatures for the six month period were dominated by the strong negative phase of the AO and the strong to moderating El Niño. Record warmth was reported in Maine, as well as above average temperatures for much of the Northeast, Great Lakes, and Pacific Northwest. Below average to much below average temperatures were present from the Rockies, across the Plains, and into the Southeast and Mid-Atlantic. The coldest temperature anomalies for the period occurred in the South and Southeast climate regions.

The first half of the Cold Season brought below normal temperatures to the contiguous U.S., with significant temperature shifts from month to month. October ranked as the fourth coolest on record, with below normal temperatures for most of the country. Oklahoma had its coolest October in 115 years. The wet conditions in conjunction with the cool temperatures were associated with the snowiest October on record. Conversely, November was very warm for the entire country and ranked as the third warmest such month on record. December marked the beginning of the strong negative phase AO. Cold arctic air filtered into the middle of the U.S. during December and brought below normal temperatures to the majority of the nation.

The second half of the Cold Season brought record warmth to much of the Northeast and above normal temperatures across the Northern tier of the country. Below normal temperatures were prevalent for the Southeast and Southern Plains, with Florida experiencing its coldest January to March period in the 116-year period of record. El Niño peaked in January as the strongly negative AO continued, allowing cold Arctic air to filter into the Deep South. Temperatures in January and February were consistently cool in the Southeast and warm for the Northeast and Northwest. The cold temperatures and abundant moisture were associated with snow falling in every state in the contiguous U.S. during February. March brought moderating temperatures to much of the U.S., as the negative phase of the AO waned and El Niño moderated. Above normal temperatures were present across the Northeast, Great Lakes, Northern Rockies, and Northwest, while below normal temperatures were present in the South and Southeast climate regions.
Between October 2009 and March 2010 the Arctic Sea Ice Extent was below average each month, with near-record low extents for October and November. As winter progressed, the ice grew slowly, but at a rate which continued to surpass the record low levels of 2006–2007. The extent of ice on the Bering side of the Arctic was above average by March, and below average on the Atlantic side. Above normal temperatures across the Arctic during the Cold Season were associated with a negative phase of the Arctic Oscillation. By March the AO was more neutral and temperatures were closer to normal over the Arctic as the ice experienced a rare late season growth spurt. The ice reached its annual maximum extent on March 31st at 15.25 million square kilometers (5.89 million square miles), which is the latest date for the maximum to occur since the satellite record began in 1979. Despite the late season growth, the average March extent was still below the long–term average. Please see the National Snow and Ice Data Center for additional information.
According to the Canadian Ice Service, at the mid-point of March, the Great Lakes had a record-low ice extent. The region experienced temperatures which were above normal or near normal every month after November, the period when the ice typically forms and is maintained. March brought temperatures that were much above average, and melted most of the ice that had previously formed. The ice extent fell below median values by mid January, and never recovered. The lack of ice over the Great Lakes has implications for summer water levels. If the lakes do not freeze during winter, more evaporation occurs, lowering the amount of water during the following Warm Season. The region also experienced a dry Cold Season. Warm and dry conditions for the region are consistent with El Niño—which was present during the Cold Season—while drier conditions are expected during the negative phase of the AO. The full impacts of both increased wintertime evaporation and abnormally dry conditions will be fully realized during the 2010 summer season.
The 2009/2010 Cold Season was marked by several significant winter storms across the United States. These storms brought snowfall to regions that do not often receive significant snow accumulations, including the Southern Plains and the Southeast. The Southwest and Northeast were also particularly hard hit, with numerous seasonal snowfall records being broken. The track of storms across the southern tier of the country and then up the Atlantic seaboard is typical of an El Niño. The snow cover extent for the contiguous U.S. during the 2009/2010 Cold Season was above average for the season as a whole, but there was significant variation from month to month. The snowy season got off to an early start with several storms impacting the U.S. during October. These storms helped produce the largest average snow extent during any October for the contiguous U.S. in the 42 year satellite record, according to Rutger's University Global Snow Lab. Conversely, November was very quiet with much below average snow cover. The following three months were cold and snowy with the extent being much above average for December (all time snowiest), January (6th snowiest), and February (3rd snowiest). During January, snow and freezing temperatures were reported as far south as central Florida. March brought temperatures which were much above normal for the northern tier of the country, and as a result there was a great deal of snowmelt. The snowmelt led to significant flooding in the Northern Plains and New England and much below average snow cover extent for the nation as a whole.
The Northeast Snowfall Impact Scale (NESIS) characterizes and ranks high-impact snowstorms in the northeastern U.S. NESIS variables used to calculate the values include the amount of snowfall and the size and population of the impacted area. Metropolitan areas along the Atlantic seaboard were affected by several snowstorms during the 2009/2010 Cold Season. Preliminary analyses indicate three storms ranked Category 3 (Major) on the NESIS scale. The storm that occurred February 23rd–28th was this season's largest in terms of NESIS and ranked as the 17th highest since the beginning of the NESIS record (1956). However, if the back-to-back punch of snowstorms on February 4th–7th and February 9th–11th were combined and treated as one storm, the resulting total would become only the third Category 5 storm (the most extreme category) of the NESIS record. Over this week-long period, more than 30 inches (76.2 cm) of snow affected approximately 12 million people, shutting down schools, airports, businesses, and government offices.
The numerous snow storms affecting the country during the 2009/2010 Cold Season led to hundreds of record snowfall accumulations. Many of the records broken were along the densely-populated Northeast corridor. Provided is a table of select seasonal snowfall records. Please visit NCDC U.S. Records for additional information.
| City, State | Amount | Previous Record, Date |
|---|---|---|
| Washington, District of Columbia–Dulles | 73.2 inches (185.9 cm) | 61.9 inches (157.2 cm), 1995–1996 |
| Washington, District of Columbia–Reagan | 56.0 inches (142.2 cm) | 54.4 inches (138.2 cm), 1898–1899 |
| Baltimore, Maryland | 80.4 inches (204.2 cm) | 62.5 inches (158.8 cm), 1995–1996 |
| Philadelphia, Pennsylvania | 78.7 inches (199.9 cm) | 65.5 inches (166.4 cm), 1995–1996 |
| Wilmington, Delaware | 72.7 inches (184.7 cm) | 55.9 inches (142.0 cm), 1995–1996 |
| Atlantic City, New Jersey | 58.1 inches (147.6 cm) | 46.9 inches (119.1 cm), 1966–1967 |
| Beckley, West Virginia | 132.9 inches (337.6 cm) | 100.1 inches (254.6 cm), 1995–1996 |
| Wichita Falls, Texas | 16.6 inches (42.2 cm) | 14.3 inches (36.3 cm), 1957–1958 |
A large, strong, and slow moving storm brought heavy snowfall to the Rockies and High Plains October 27th–30th. The heaviest snowfall amounts occurred along the Front Range in Colorado, with 46 inches (117 cm) reported northwest of Denver, and snowfall rates as high as two inches (5 cm) per hour. As the storm moved eastward, blizzard conditions were widespread. The storm affected portions of Colorado, Kansas, Nebraska, New Mexico, South Dakota, Utah, and Wyoming, with many major highways and interstates closed due to treacherous conditions. The storm contributed to parts of Wyoming and Nebraska having their all-time snowiest months on record.
| City, State | Record | Amount |
|---|---|---|
| Cheyenne, Wyoming | Snowiest October on record | 28.0 inches (71.1 cm) |
| North Platte, Nebraska | Snowiest month on record | 30.3 inches (77.0 cm) |
| Rochester, Minnesota | Snowiest October on record | 7.9 inches (20.1 cm) |
A strong storm developed on December 4th over the Gulf of Mexico, while arctic air was moving in behind an upper level trough. This combination led several locations in the Gulf Coast region to receive their earliest accumulating snowfall. Houston, Texas received 1.0 inch (2.5 cm), Lake Charles, Louisiana observed 0.2 inches (0.5 cm), and Lafayette, Louisiana measured 0.3 inches (0.8 cm). The previous earliest snowfall records for this area occurred the previous year on December 11th, 2008 when a similar weather situation occurred.
The first major winter storm of December 2009 occurred on the 6th–11th. The system moved onshore from the Pacific Ocean, crossed the Rocky Mountains, moved through the northern Plains States, across the Great Lakes region, and into New England. Snowfall greater than a foot (30 cm) was observed in a string of states from California to Maine. Blizzard conditions were reported across Minnesota, Iowa, Wisconsin, and Michigan with many stations in these states experiencing snow accumulations ranking in the top five for any given storm.
The second major winter storm of December affected the Mid-Atlantic and Northeast on December 18th–21st, leaving behind 1–2 feet (30.5 cm–61.0 cm) of snow from North Carolina to New England. The storm at one point was over 500 miles (800 km) in width, eventually affecting 14 states and tens of millions of Americans. The heavy snow crippled the densely populated corridor from Richmond, Virginia to Boston, Massachusetts. Reagan National Airport in Washington, DC experienced its largest calendar day snowfall acumulation on record with 15.0 inches (38.1 cm). The storm was given a preliminary score of Category 3 on the Northeast Snow Impact Scale (NESIS), categorizing the storm as 'Major' and ranking it in the top 25 winter storms to affect the region.
The third major winter storm of December presented a huge part of the country with a white Christmas. The large storm produced blizzard conditions from Texas to the U.S.–Canadian border on December 24th–27th. Dallas, Texas observed its first Christmas Eve snowfall on record. The storm was associated with the most snowfall to affect Oklahoma City, Oklahoma in a 24-hour period (14.1 inches or 35.8 cm) and was the second biggest storm accumulation for Sioux City, South Dakota on record (20.7 inches or 52.6 cm). The storm left travelers stranded in airports and on highways, as many people were in transit for the holiday season.
| City, State | Record | Amount |
|---|---|---|
| Valdez, Alaska | Second all-time highest 24-snowfall | 38.7 inches (72.9 cm) |
| Sioux City, South Dakota | Snowiest December | 32.4 inches (82.3 cm) |
| Des Moines, Iowa | Snowiest December | 27.7 inches (70.4 cm) |
| Topeka, Kansas | Snowiest December | 19.2 inches (48.8 cm) |
| Philadelphia, Pennsylvania | Snowiest December on record | 24.1 inches (61.2 cm) |
| Jackson, Kentucky | Snowiest December on record | 17.6 inches (44.7 cm) |
| King Salmon, Alaska | Second least snowiest December | 1.5 inches (3.8 cm) |
An intense low pressure system moving along the Northeast coast brought over two feet (61 cm) of snow to New England on January 2nd and 3rd. Boston suburbs received as much as 13 inches (33 cm) of accumulation. The National Weather Service office in Burlington, Vermont measured 33.1 inches (84.1 cm) of snowfall for the event, marking the largest snowfall event recorded for the city. The previous heaviest snowfall occurred in December 1969, when the city received 29.8 inches (75.7 cm).
A series of strong Pacific storms impacted the West and Southwest on January 17th–23rd, leaving behind several feet of snow across the higher terrain and breaking numerous lowest barometric pressure records across the region, including the major cities of Los Angeles (983.3 mb), San Diego (987.0 mb), Salt Lake City (979.9 mb), Las Vegas (983.0 mb), and Phoenix (983.0 mb). Several of the stations breaking pressure records have data going back at least 140 years.
A large winter storm, bringing snow, sleet, and freezing rain paralyzed the Southern tier of the U.S. on January 27th–30th. Wintry precipitation hit a string of states from New Mexico to New Jersey, closing major interstates including large stretches of Interstate 40, an important east-west transportation artery for the country.
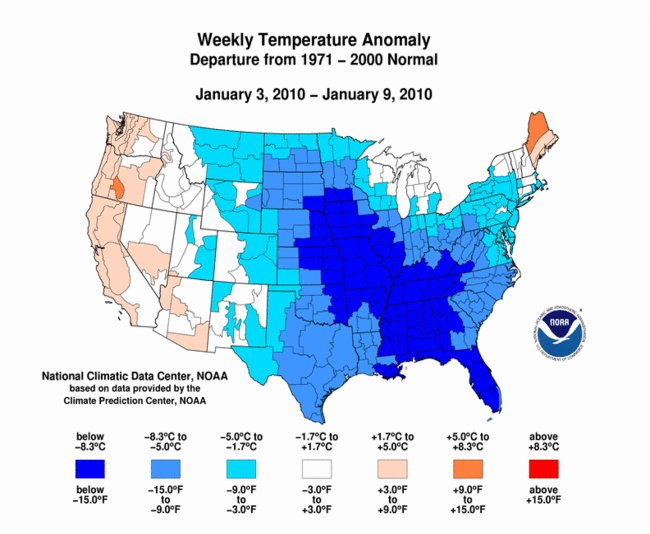
During the first half of January, Florida temperatures were especially cold as a succession of arctic air masses advected southward. Pensacola, Florida recorded its second longest streak (10 days) of consecutive days with temperatures less than or equal to 32°F (0°C). The longest streak was 13 consecutive days in 1940. On January 11th, the airport in Key West recorded a temperature of 42°F (5.6°C), bested only by the 41°F (5.0°C) recorded on January 13th, 1981 and January 12th, 1886. In Daytona Beach, temperatures did not exceed 60°F (16°C) for a 12 day period. In fact, records were broken or tied at Daytona Beach, Orlando, Melbourne, and Vero Beach, Florida for the greatest number of consecutive days in which the daily high temperature remained below 60°F (16°C).
For the entire month in Florida, 175 new lowest minimum temperature records were established. There were also 158 new lowest maximum temperature records set. The unusually cold conditions in Florida were accompanied by snow flurries in Orlando, Florida on the 9th. Cold arctic air continued to filter in from Canada, leading to the fourth coolest February and March on record for the state, and resulting in an all-time record cold January–March.
Florida's citrus belt was greatly affected by the surge of cold air. On January 6th–7th and again on the 10th–12th, farmers waged a war against the sub-freezing temperatures, while trying to protect their citrus, strawberry, and vegetable crops. According to the U.S. Department of Agriculture, Florida's strawberry production had a 39 percent decline in 2010 when compared to the 237.6 million pounds produced in 2009. At last year's prices, the 2010 loss would equate to about $124 million. Specialty agricultural interests, such as nursery crops and tropical fish, sustained heavy losses. It is estimated that a total economic crop loss in Florida exceeded $450 million. The record cold weather also caused ocean temperatures in the Florida Keys to drop below 59°F (15°C), bleaching and killing coral reefs, which cannot survive the sustained cool water temperature. Area coral experts reported that they had not seen a bleaching of this magnitude due to cold temperatures since the winter of 1977/1978 (Source: AFP).
| City, State | Record | Amount |
|---|---|---|
| Burlington, Vermont | Snowiest January | 48.4 inches (122.9 cm) |
| Sioux City, Iowa | All-time max snow depth record | 28.0 inches (71.1 cm) |
On February 4th a storm that originated in the southwest U.S. traversed eastward, pumping in moisture from the Gulf of Mexico and the Atlantic. Some locations in Maryland, Pennsylvania, Virginia, and West Virginia recorded more than 30 inches (76 cm) of snow. In Washington, DC (Reagan National Airport), the two-day total of 32.4 inches (82.3 cm) ranked as the highest total storm amount in history. In Philadelphia, the 28.5 inches (72.4 cm) ranked as the second highest amount, behind the 30.7 inches (78.0 cm) received on January 7th–8th, 1996. The 25.0 inches (63.5 cm) that fell in Baltimore was its third highest storm total amount since official records began in 1891.
Another blizzard created havoc during February 9th–11th on the areas that were still digging out from the February 5th–6th storm. This powerful Nor'easter produced as much as 14 inches (35.6 cm) of snow in the Washington, DC area, 17 inches (43.2 cm) in New Jersey, 20 inches (50.8 cm) in Baltimore, as much as 24 inches (61.0 cm) in northern Maryland, and more than 27 inches (68.8 cm) in Pennsylvania. As a result of these two storms, several locations broke seasonal snowfall records, some of which were more than a century old.
On February 11th–13th, as much as 6 inches (15 cm) of snow fell in Louisiana, Alabama, Mississippi, and even the northwest Panhandle of Florida. The highest ever daily snowfall was recorded in Dallas, Texas The Dallas/Fort Worth National Weather Forecast office reported that 11.2 inches (28.4 cm) bested the old record of 7.8 inches (19.8 cm) set on January 15th, 1964 and January 14th, 1917. On February 13th every contiguous U.S. state had snow on the ground.
| City, State | Record | Amount |
|---|---|---|
| Pittsburgh, Pennsylvania | Snowiest month on record | 51.2 inches (130.0 cm) |
| New York City (Central Park), New York | Snowiest month on record | 36.9 inches (93.7 cm) |
| Harrisburg, Pennsylvania | Snowiest February | 34.5 inches (87.6 cm) |
| Cincinnati, Ohio | Snowiest February | 23.1 inches (58.7 cm) |
| Charleston, West Virginia | Snowiest February | 25.6 inches (65.0 cm) |
A strong storm brought heavy snowfall from the Rocky Mountain Front Range across the Southern Plains on March 19th–22nd, creating a white start to the beginning of spring. The snowfall, coupled with strong winds, caused near-blizzard conditions in Oklahoma, Texas, Arkansas, and Missouri. The storm brought over 20 inches (51 cm) of snow to portions of Wyoming, Colorado, and New Mexico. Accumulations over 10 inches (25 cm) were common across the rest of the Southern Plains, with portions of Missouri, Kansas, and Arkansas receiving over a foot (30 cm) of snow. This storm also topped off a very snowy season for the region. Oklahoma City, Oklahoma had its fifth snowiest winter with 23.3 inches (59.2 cm) of snowfall, and Wichita Falls, Texas had its snowiest season with 16.6 inches (42.2 cm).
The northeastern U.S. and southern Canada in particular had very little snow during March. For the first time on record, both Syracuse and Rochester, New York received no snowfall for the month. The montly average snowfall for these cities is 18.2 inches (46.2 cm) and 15.6 inches (39.6 cm), respectively. In Canada, unusually low snow accumulations were widespread. Toronto averages 9 inches (23 cm) of March snow, but for the first time since 1845, no snow was observed in the city. Ottawa, Montreal, and Calgary all experienced much below average snowfall for the month. Light snow accumulations during March across these regions is consistent with an El Niño which was present for the entire winter season.
Several factors caused another year of historic flooding along the Red River in the northern Plains. In the fall, exceptionally wet soils in advance of the winter freeze produced substantial frost depths which limited water infiltration, increasing runoff. These conditions persisted into the winter months as precipitation continued to be above-normal. With the help of sub-zero temperatures, 1–3 foot (31–91 cm) frost depths in the Upper Midwest were common. Another contributing factor was the water content of the snowpack. In the Upper Midwest the water content ranged from 2 to 10 inches (5 to 25 cm). Although the snow depth and snow water equivalent were much higher, when compared to the historical flooding that occurred in 2009, the above normal temperatures exacerbated the runoff. On March 21st, the Red River at Fargo peaked at 36.99 feet (11.3 m) , 19 feet (5.8 m) above flood stage.
The New England area experienced their 11th wettest October–March period on record. The breaking point came in March, when the combination of snowmelt and persistent rainstorms drenched the area and caused significant flooding. In Boston, 14.87 inches (377.7 mm) of precipitation was a March record. The 16.34 inches (415.0 mm) of precipitation that fell in Providence, Rhode Island was also a record for March. Precipitation totals of 5–9 inches (127–228.6 mm) caused unprecedented flooding in this area. The Pawtuxet River in Rhode Island crested at a new high of 20.79 feet (6.2 m), 12 feet (3.7 m) above flood stage. The Taunton and Sudbury Rivers in Massachusetts and the Yantic River in Connecticut also reached new record heights. Throughout the affected areas, bridges and roads were damaged, while businesses and homes filled with debris and toxic floodwaters. It was reported that some of the flooding was the worst in 200 years.
The chart to the right shows the historic trend of the Arctic Oscillation and the El Niño Southern Oscillation back to 1950. The combination of these two large-scale patterns was associated with cool temperatures for most of the U.S. and significant amounts of precipitation. At no point since 1950 was the combination of these factors as extreme as the 2009/2010 Cold Season. The AO was at an all–time record low index while the warm phase of ENSO was in its top five. Other seasons that had a concurrent negative phase AO and warm phase ENSO were also particularly harsh for the contiguous United States, for example the winters of 1957/1958, 1968/1969, and 1977/1978.
The winter (December–February) of 1977/1978 was a particularly snowy season for the United States and North America. According to data from Rutger's University Global Snow Lab, the North American snow extent for the 2009/2010 winter was second only to 1977/1978. The 1977/1978 winter also had a moderate El Niño in the Equatorial Pacific and negative phase of the Arctic Oscillation. Two significant blizzards impacted the Great Lakes and Northeast regions of the U.S. on January 19th–21th, 1978 and February 5th–7th, 1978. The January storm was ranked a Category 4 on the NESIS scale and ranks as the eigth highest NESIS score, while the February storm was a Category 3 storm and ranks as the 13th highest score. A similar situation happened this 2009/2010 winter season with two large storms impacting the region back to back in February.
This report provides a preliminary analysis of the 2009/2010 Cold Season, which brought record temperatures, snow, rain, and drought to the country. The season will not soon be forgotten by those who were impacted by the extreme weather events that were widespread during the six-month period. The densely populated Northeast Corridor received several significant snow storms which caused many cities to have their all-time snowiest Winter Season. Florida experienced a record cold snap which caused hundreds of millions of dollars of crop losses, while Hawaii had a record drought that also brought sizable negative agricultural impacts. Several Gulf Coast locations had their earliest accumulating snowfall, while Maine had its record warmest October–March period on record. Melting snow and copious rainfall raised river levels in New England to their highest water levels ever recorded. These regional events were likely influenced and enhanced by larger scale climate patterns — the record low index of the Arctic Oscillation and the strong El Niño.
For more information about content specific to this page, please Contact Us.


