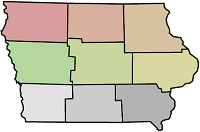


Groundwater levels for each climate district are obtained from a series of monitoring wells that provide near real-time values measured as depth below land surface. These wells have been centrally located within each climate district and drilled to a specific depth to provide a representative water table status for that district. Most of these wells are located in unconsolidated glacial materials and do not represent the uppermost aquifer in the area. Mean daily water levels are shown here, however near real-time values can be obtained by clicking on the individual monitoring well sites.
| District | Site Name | Location | Elevation (topo) | Well Depth | Date Drilled |
|---|---|---|---|---|---|
| Northwest | IACRN-1 | O Brien County | 1305 | 28.5 | 4/22/2008 |
| North Central | IACRN-2 | Hancock County | 1250 | 23.9 | 4/23/2008 |
| Northeast | IACRN-3 | Fayette County | 1210 | 23 | 7/1/2008 |
| East Central | IACRN-4 | Johnson County | 756 | 82.5 | 10/1941 |
| Central | IACRN-5 | Marshall County | 1020 | 23 | 5/13/2008 |
| West Central | IACRN-6 | Crawford County | 1420 | 48 | 4/24/2008 |
| Southwest | IACRN-7 | Montgomery County | 1275 | 40 | 6/1937 |
| South Central | IACRN-8 | Lucas County | 1070 | 27.3 | 5/14/2008 |
| Southeast | IACRN-9 | Jefferson County | 710 | 23 | 7/29/2008 |
Current Water Year Daily Mean Groundwater Levels
Show/Hide:
*Maximums and minimums are not currently shown because of a short period of record.*
Historic Daily Mean Groundwater Levels
Show/Hide: