(SST is defined as the skin temperature of the ocean surface water.)
| CoastWatch SST | CoastWatch sea surface temperatures are derived from a set of multi-channel atmospherically corrected algorithms using brightness temperatures from channels 3, 4 and 5, albedo information from channels 1 and 2 and satellite and solar zenith angles. Product Links: Overview | Geographic Locations | Data Archive |
|
|
||
| POES | Resolution: 1 or 4 Km | Frequency: Varies by Satellite |
| SST Anomaly Charts | The SST anomaly field (degrees C) is the difference between the 50 km nighttime-only SST and the nighttime-only monthly mean SST climatology. The climatology is based on nighttime observations from 1984-1993, with SST observations from the years 1991 and 1992 omitted due to aerosol contamination from the eruption Mt. Pinatubo in June of 1991. Product Link |
|
|
||
| POES | Resolution: 50 Km | Frequency: Twice Weekly |
| SST Contour Charts | Graphical depiction of Sea Surface Temperature gridded products. Contour charts are used to depict both global and regional SST values in various grid spacing. Product Link |
|
|
||
| POES | Resolution: 14 to 100 Km | Frequency: Daily to Twice Weekly |
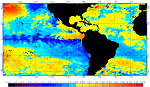
| SST Images | A gridded-image composite of sea surface temperatures in degrees C derived from 8-km resolution Global SST Observations. Generated daily on a global scale at 50 and 100 km resolutions. Generated twice weekly (Tuesday and Saturday) for selected locations. Product Link |
|
|
||
| POES | Resolution: 14 to 100 Km | Frequency: Daily to Twice Weekly |
| SST Nighttime Field Image Charts | The operational night-only SST analysis is at a resolution of 50 km and is used to produce the SST anomaly charts. Product Link |
|
|
||
| POES | Resolution: 50 Km | Frequency: Twice Weekly |
| SST Monthly Mean | A satellite-only monthly mean time series of SST at 36 km resolution has been provided by Al Strong (ORA/ORAD) based on only nighttime SST satellite observations. These datasets, based on NESDIS's AVHRR data, have been accumulated into weekly means (U of Miami - RSMAS) and provided to NASA-JPL for distribution. Some SST monthly means are omitted due to contamination by volcanic aerosols (1981-1983 and some of 1991-1992 due to the eruption of Mt. Pinatubo). Product Link |
|
|
||
| POES | Resolution: 36 Km | Frequency: Monthly |
| CoastWatch SST | Color enhanced versions of Sea Surface Temperatures from GOES Imager. The GOES-11 and 12 imagers observe both northern and southern hemisphere every half an hour. These 5-band (0.6, 3.9, 6.7, 10.7, 12 or 13.3 micron) and 4-band (0.6, 3.9, 6.7, 10.7. or 13.3 micron) images are processed to retrieve SST retrievals at 4-km resolution. The infrared channels determine the SST, and all channels (except the 6.7 and 13.3 km) determine the cloud contamination. These retrievals are remapped, averaged and composited hourly and made available for users to access. Product Link |
|
|
||
| GOES | Resolution: 4 Km | Frequency: 3 hour and 24 hour Averages |