 |
||||
|
|
|
|||


| |
Great Lakes Water Level ObservationsGreat Lakes water levels constitute one of the longest high quality hydrometeorological data sets in North America with reference gage records beginning about 1860 with sporadic records back to the early 1800's. These levels are collected and archived by NOAA's National Ocean Service. Interactive Great Lakes Water Level Dashboard (Version 1.5)
The Great Lakes Water Level Dashboard was designed for convenience in viewing lake levels and forecasts at a variety of time scales. By adjusting the endpoints of the slider below the x-axis, you can select the time frame of interest. Many options are available for customizing the graphs in addition to time scale. The '?' box is a good place to start. Click on image to access dashboard. The dashboard is best viewed at a screen resolution of at least 1024 x 768. If you are using a mobile device (without Flash) you will only have access to recent years and no pan/zoom features. Click here to download dashboard text-based data files Click here to see a beta version of the Great Lakes Hydro-Climate Dashboard (features precipitation, evaporation, runoff, net basin supplies, and ice data) Water Level PlotsDaily levels compared with last year's levelsSuperior Daily levels compared with monthly Min, Max, and Mean levelsSuperior NOTE: The above plots contain raw data that have not been subjected to the National Water Level GagesThe above plots use data from the gages listed below to represent the levels on each lake.
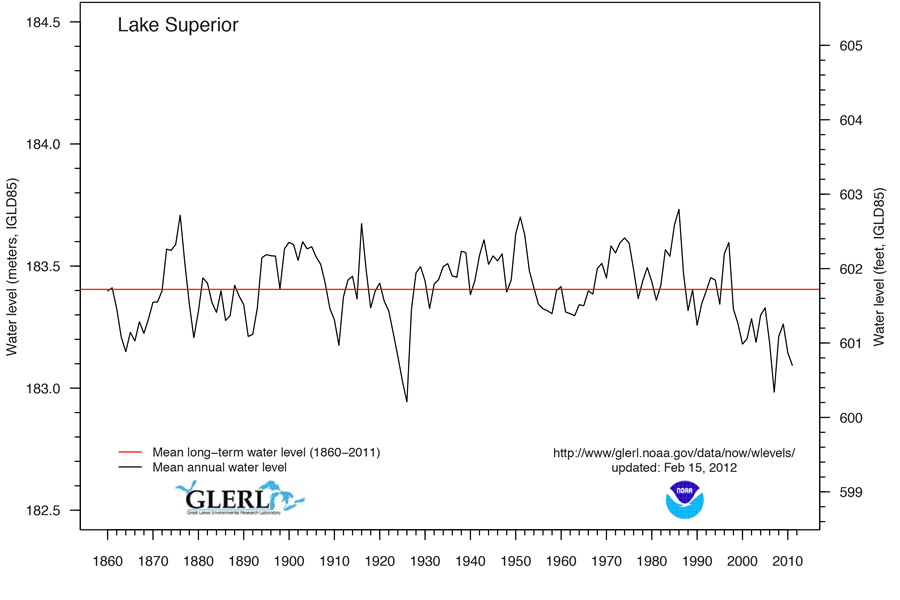
Water level gages information provided by NOS’s Center for Operational Oceanographic Products and Services. HydrographsA hydrograph provides a way of seeing seasonal and yearly changes in the flow or discharge of a waterway. The hydrographs for the Great Lakes period of record (starting in 1860 or 1900) illustrate different water regimes over time. The data files below contain the annual average water level for every year as well at the long-term mean level in meters, IGLD85.
GLERL’s Monthly Hydrologic Data (1860-Present) Monthly Bulletin of Great Lakes Water Levels
Canadian Hydrographic Service
Hourly Water Level Data Contact:
|

GLERL ResourcesAdvanced Hydrologic Prediction System (AHPS): Research Forecasting Tool Water Levels Brochure - Current (.pdf) Graph comparing Great Lakes levels from 1860 to present with sea level rise (.pdf) Climate Change Impacts on Great Lakes Water Levels (2011 webinar) Archived Water Level Brochures NOAA ResourcesMeasurement of Great Lakes Water Levels NOS CO-OPs Water Level Gage Data (Great Lakes Online) NDBC Recent Marine Data - Eastern Great Lakes NDBC Recent Marine Data - Western Great Lakes Other ResourcesWater Levels on the Great Lakes (GLIN Network) Proceedings from Paleo Water Levels in the Great Lakes(pdf) |