You're surfing around Flickr on a Guest Pass to see kansen.chu's "History of Berryessa" set and other content they're sharing with family and friends.
|
|
U.S. GAO's photostream Pro User |
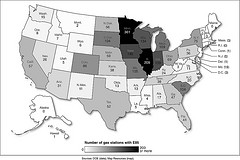
Figure 4: Number of Gas Stations that Sell E85 in Each State, as of December 31, 2010
This image is excerpted from a U.S. GAO report: www.gao.gov/products/GAO-11-386
Uploaded on May 31, 2011
221 views

Figure 2: Example of an LLV and FFV, 2010
This image is excerpted from a U.S. GAO report: www.gao.gov/products/GAO-11-386
Uploaded on May 31, 2011
195 views

Figure 1: Top Six U.S. Seafood Import Sources in 2009
This image is excerpted from a U.S. GAO report: www.gao.gov/products/GAO-11-286 Note: Percentages do not add up to 100 percent due to rounding.
Uploaded on May 31, 2011
201 views / 1 favorite

Figure 4: Percent of Federally Assigned Spectrum Located in Various Ranges
This image is excerpted from a U.S. GAO report: www.gao.gov/products/GAO-11-352 Note: In addition, two...
Uploaded on May 16, 2011
267 views
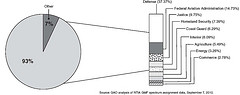
Figure 3: Federal Agencies with the Most Spectrum Assignments
This image is excerpted from a U.S. GAO report: www.gao.gov/products/GAO-11-352 Note: Other includes...
Uploaded on May 16, 2011
241 views

Figure 1: Examples of Allocated Spectrum Uses, and Federal Spectrum Use in the High-Value Range
This image is excerpted from a U.S. GAO report: www.gao.gov/products/GAO-11-352
Uploaded on May 16, 2011
414 views

Figure 10: International and U.S. Commitments and Actions to Address Food Security and Nutrition, 1996 through 2015
This image is excerpted from a U.S. GAO report: www.gao.gov/products/GAO-11-491
Uploaded on May 16, 2011
187 views / 1 favorite

Figure 8: Loading of U.S. Food Aid Commodities at Jacintoport, Texas
This image is excerpted from a U.S. GAO report: www.gao.gov/products/GAO-11-491 Source: GAO. This photo...
Uploaded on May 16, 2011
244 views

Figure 7: Examples of Vegetable Oil and CSB Packaging Problems
This image is excerpted from a U.S. GAO report: www.gao.gov/products/GAO-11-491 Source: GAO. Improper...
Uploaded on May 16, 2011
402 views
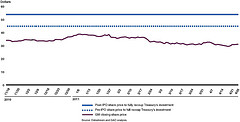
Figure 2: GM Share Price for November 18, 2010, through April 26, 2011, and the Pre- and Post-IPO GM Share Price Needed to Fully Recoup Treasury's Investment
This image is excerpted from a U.S. GAO report: www.gao.gov/products/GAO-11-471
Uploaded on May 16, 2011
233 views

Figure 1: Current Storage Sites for Commercial Spent Nuclear Fuel and Proposed Yucca Mountain Repository Site
This image is excerpted from a U.S. GAO report: www.gao.gov/products/GAO-11-229 Note: Locations...
Uploaded on May 16, 2011
450 views / 1 favorite
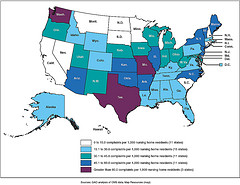
Figure 1: Number of Nursing Home Complaints Reported by Each State Survey Agency per 1,000 Nursing Home Residents, 2009
This image is excerpted from a U.S. GAO report: www.gao.gov/products/GAO-11-280 Note: CMS’s database may...
Uploaded on May 16, 2011
281 views
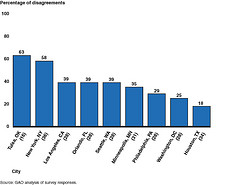
Figure 5: Percentages of Agents Who Reported Having Disagreements with Another Component over Roles and Responsibilities over the Past 5 Years, by City
This image is excerpted from a U.S. GAO report: www.gao.gov/products/GAO-11-314 Notes: The numbers...
Uploaded on May 16, 2011
158 views

Figure 1: Jurisdictions Shared by DOJ Agencies
This image is excerpted from a U.S. GAO report: www.gao.gov/products/GAO-11-314
Uploaded on May 16, 2011
148 views

Figure 1: Process for Nonimmigrant Entry to and Exit from the United States
This image is excerpted from a U.S. GAO report: www.gao.gov/products/GAO-11-411
Uploaded on May 6, 2011
219 views / 1 favorite
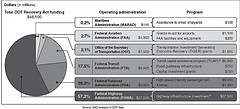
Figure 1: Recovery Act Funds Appropriated to DOT Programs
This image is excerpted from a U.S. GAO report: www.gao.gov/products/GAO-11-610T a) TCAP includes...
Uploaded on May 6, 2011
197 views

Figure 2: Typical Judicial and Nonjudicial Foreclosure Processes
This image is excerpted from a U.S. GAO report: www.gao.gov/products/GAO-11-433
Uploaded on May 6, 2011
286 views
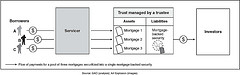
Figure 1: Flow of Payments in a Basic Securitized Transaction
This image is excerpted from a U.S. GAO report: www.gao.gov/products/GAO-11-433
Uploaded on May 6, 2011
237 views