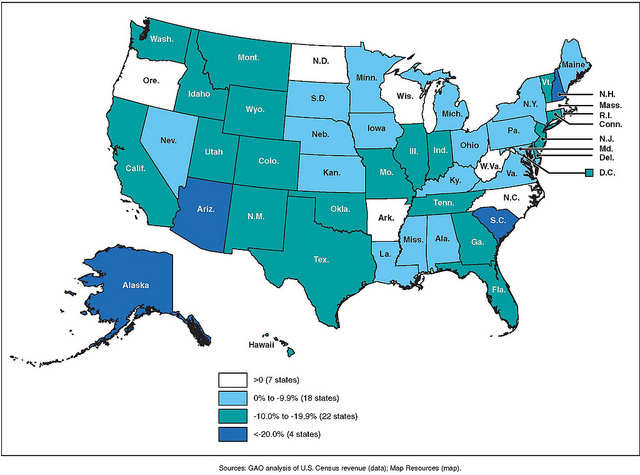
Figure 3: Percentage Change in State Tax Revenue, Fourth Quarter 2007 to Fourth Quarter 2009
This image is excerpted from a U.S. GAO report: www.gao.gov/products/GAO-11-395
Notes: Map shows the total percent change in quarterly tax revenue for each state from the fourth quarter 2007 to the fourth quarter 2009.
“States” includes the District of Columbia.


Comments and faves