You're surfing around Flickr on a Guest Pass to see kansen.chu's "History of Berryessa" set and other content they're sharing with family and friends.
|
|
U.S. GAO's photostream Pro User |

Figure 14: Geographic Distribution of Electricity Generation from Fossil Fuel Electricity Generating Units, 2010
This image is excerpted from a U.S. GAO report: www.gao.gov/products/GA O-12-545R Air Emissions and Electricity Generation at U.S. Power Plants
Uploaded on Jun 1, 2012
225 views

Figure 1: Sample Layout of Emissions Controls at a Coal Power Plant
This image is excerpted from a U.S. GAO report: www.gao.gov/products/GA O-12-545R Air Emissions and Electricity Generation at U.S. Power Plants
Uploaded on Jun 1, 2012
281 views
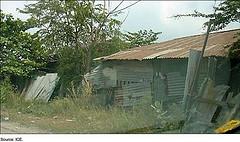
Figure 5: Facility in Thailand Falsely Described as Honey Manufacturing Plant
This image is excerpted from a U.S. GAO report: www.gao.gov/products/GA O-12-551 ANTIDUMPING...
Uploaded on Jun 1, 2012
143 views

Figure 4: Boxes of Chinese Wood Flooring Brought into the United States through Evasion
This image is excerpted from a U.S. GAO report: www.gao.gov/products/GA O-12-551 ANTIDUMPING...
Uploaded on Jun 1, 2012
196 views
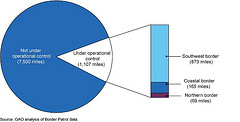
Figure 1: U.S. Border Miles Reported by Border Patrol to be under Operational Control, as of September 30, 2010
This image is excerpted from a U.S. GAO report: www.gao.gov/products/GAO -12-688T BORDER PATROL SECURITY:...
Uploaded on May 15, 2012
224 views
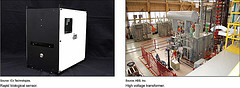
Figure 1: Prototypes Developed by the Science and Technology Directorate
This image is excerpted from a U.S. GAO report: www.gao.gov/products/GAO -12-557 DEPARTMENT OF...
Uploaded on May 15, 2012
151 views
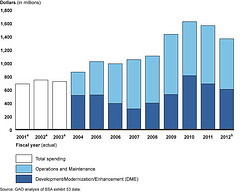
Figure 2: SSA IT Funding for Fiscal Years 2001 through 2012
This image is excerpted from a U.S. GAO report: www.gao.gov/products/GAO -12-495 SOCIAL...
Uploaded on May 15, 2012
154 views

Figure 1. Location of Oil Shale Resources in Colorado and Utah
This image is excerpted from a U.S. GAO report: www.gao.gov/products/GAO -12-740T UNCONVENTIONAL OIL...
Uploaded on May 15, 2012
156 views
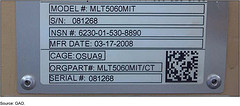
Figure 1: Data Plate with IUID Data Matrix
This image is excerpted from a U.S. GAO report: www.gao.gov/products/GAO -12-482 DEFENSE...
Uploaded on May 15, 2012
135 views
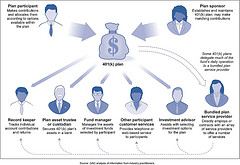
Figure 1: Structure of Service Provider Arrangements in 401(k) Plans
This image is excerpted from a U.S. GAO report: www.gao.gov/products/GAO -12-328 DEFINED...
Uploaded on May 15, 2012
202 views
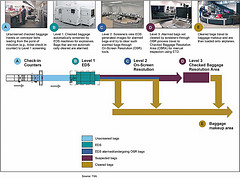
Figure 4: A Diagram of a Checked Baggage Inspection System and Three Levels of Screening
This image is excerpted from a U.S. GAO report: www.gao.gov/products/GAO -12-266 CHECKED...
Uploaded on May 15, 2012
281 views
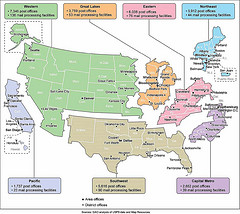
Figure 1: Location of Field Offices and Information on the Number of Post Offices and Mail-Processing Facilities in Each USPS Area
This image is excerpted from a U.S. GAO report: www.gao.gov/products/GAO -12-506 U.S. POSTAL...
Uploaded on May 15, 2012
130 views

Figure 2: Changes in Statement of Budgetary Resources (SBR) Interim Milestones
This image is excerpted from a U.S. GAO report: www.gao.gov/products/GAO -12-642T DOD...
Uploaded on Apr 26, 2012
212 views

Figure 2: Significant OSHA Health Standards Timeline
This image is excerpted from a U.S. GAO report: www.gao.gov/products/GAO -12-330 WORKPLACE SAFETY...
Uploaded on Apr 26, 2012
165 views

Figure 1: Significant OSHA Safety Standards Timeline
This image is excerpted from a U.S. GAO report: www.gao.gov/products/GAO -12-330 WORKPLACE SAFETY...
Uploaded on Apr 26, 2012
201 views

Figure 5: Estimated Effect of Rent Reform Options on Monthly Rents of Affected Voucher-Assisted Households, by Household Type
This image is excerpted from a U.S. GAO report: www.gao.gov/products/GAO -12-300 HOUSING CHOICE VOUCHERS:...
Uploaded on Apr 26, 2012
152 views
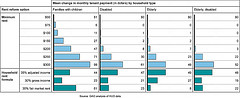
Figure 4: Estimated Effect of Rent Reform Options on Monthly Rents of All Voucher-Assisted Households, by Household Type
This image is excerpted from a U.S. GAO report: www.gao.gov/products/GAO -12-300 HOUSING CHOICE VOUCHERS:...
Uploaded on Apr 26, 2012
163 views

Figure 2: Median Gross Rents (2011 Constant Dollars) for Units Leased by Voucher-Assisted Households, from 2003 through 2010
This image is excerpted from a U.S. GAO report: www.gao.gov/products/GAO -12-300 HOUSING CHOICE VOUCHERS:...
Uploaded on Apr 26, 2012
172 views / 1 comment