Archives / Posted in / 2012 / July (27 items)
View: Large thumbnails Map Calendar
1 2 3 4 5 6 7 8 9 10 11 12 13 14 15 16 17 18 19 20 21 22 23 24 25 26 27 28 29 30 31
 
Figure 5: Administrative Expenses as a Percent of Total Hardest Hit Fund Disbursements, by State, Cumulative through March 2012

Figure 5: Administrative...

 
Figure 3: Hardest Hit Fund Allocations and Borrower Assistance Provided, as a Percentage of the Total Allocation, by State, as of March 2012

Figure 3: Hardest Hit Fund...

 
Figure 2: A Private Home in Montana Before and After Wildland Fire Mitigation Work Was Completed Using Title III Funds

Figure 2: A Private Home in...

 
Figure 1: Mobile Firewise Trailer Used to Educate Residents on Firewise Principles

Figure 1: Mobile Firewise...

 
Figure 5: Segments of Conflict Minerals Supply Chains Supported by Stakeholder-Developed Initiatives

Figure 5: Segments of Conflict...

 
Figure 13: Building Constructed in Right-of-Way (left) and Unauthorized Access Road and Removed Guardrail (right)

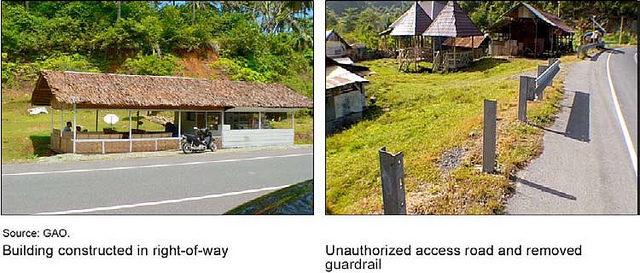
Figure 13: Building Constructed...

 
Figure 11: Features Intended to Enhance Sustainability of Indonesia Coastal Road

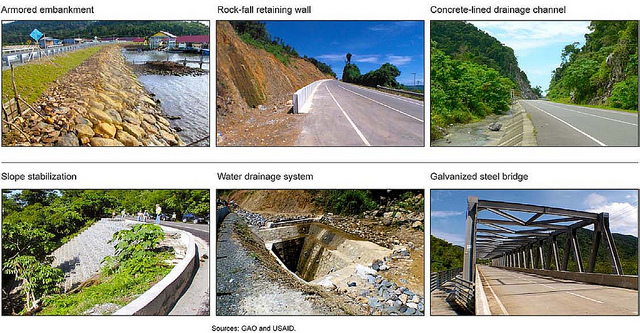
Figure 11: Features Intended to...

 
Figure 1: State Concealed Carry Permit Designation for 2002 and 2012

Figure 1: State Concealed Carry...

 
Figure 1: SSA’s Five-Step Sequential Evaluation Process for Determining Disability

Figure 1: SSA’s Five-Step...

 
Figure 2: Full, Private Charter, and Twelve-Five Security Program Requirements

Figure 2: Full, Private Charter,...

 
Figure 3: Proportion of the Adult Population with Limited English Proficiency, 2008-2010, and Key Markets Targeted by76_Fig03

Figure 3: Proportion of the...

 
Figure 3: Distribution of “Fallow” Farms—Those That Did Not Grow Any Crop of Any Type—Each Year from 2007 through 2011 for Which Direct Payments Were Made

Figure 3: Distribution of...

 
Figure 2: Direct Payments by County, 2011

Figure 2: Direct Payments by...

 
Figure 6: Restoration of the Headwaters of the Big Darby River in Ohio

Figure 6: Restoration of the...

 
Figure 5: An Eastern Washington Stream Channeled to Maximize Crop Yield

Figure 5: An Eastern Washington...

 
Figure 1: A Watershed

Figure 1: A Watershed

 
Figure 1: Number of Regulation A Offerings Filed and Qualified, Fiscal Years 1992 through 2011

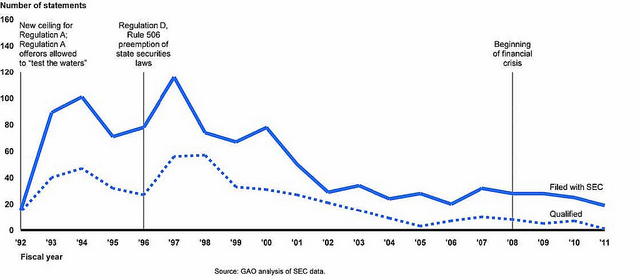
Figure 1: Number of Regulation A...

 
Figure 1: Federal Health Care Center (FHCC) Oversight Structure

Figure 1: Federal Health Care...

 
Figure 4: Division of the Samtskhe-Javakheti Roads Rehabilitation Project into Lots

Figure 4: Division of the...

 
Figure 3: Scope Changes for the Samtskhe-Javakheti Roads Rehabilitation Project

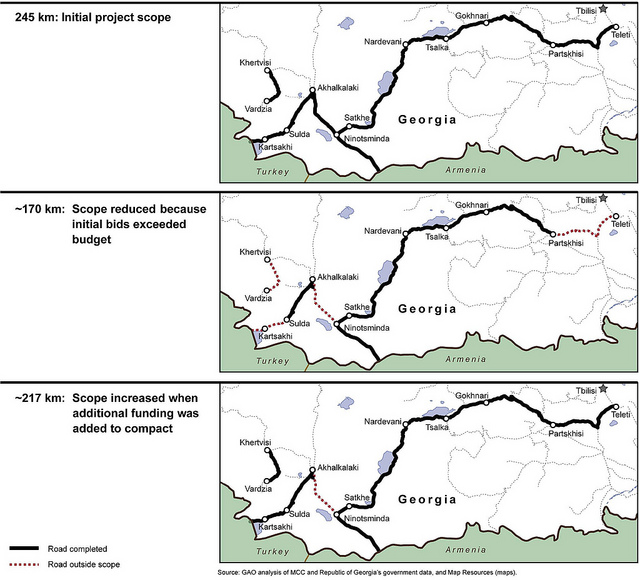
Figure 3: Scope Changes for the...

 
Figure 3: Inefficient and Unnecessary Use of Multiple 60-kilowatt Generator Sets at Camp Sabalu-Harrison

Figure 3: Inefficient and...

 
Figure 2: Timeline of Key Events in OEP&P’s Efforts to Manage Operational Energy Issues

Figure 2: Timeline of Key Events...

 
Figure 1: Configuration of Operational Polar Satellites

Figure 1: Configuration of...

 
Figure 3: Initial Level Allowances for SSI Children with Mental Impairments, by Primary Impairment, Fiscal Years 2000 to 2011

Figure 3: Initial Level...

 
Figure 1: SSI Benefit Awards to Children with Mental Impairments and Key Policy Changes, 1983 to 2011

Figure 1: SSI Benefit Awards to...

 
Figure 3: Total Permanent Loan Modifications through Programs at Federal Agencies and the Enterprises, January 2009 through December 2011

Figure 3: Total Permanent Loan...

 
Figure 1: Multiple Congressional Committees, Federal and State Agencies, and Other Entities Oversee and Administer 45 Federal Programs that Support Employment for People with Disabilities

Figure 1: Multiple Congressional...