You're surfing around Flickr on a Guest Pass to see kansen.chu's "History of Berryessa" set and other content they're sharing with family and friends.

Archives / Posted in / 2012 (239 items)
View: Large thumbnails Map Calendar
 
Figure 2: Timeline of California High Speed Rail Project

Figure 2: Timeline of California...

 
Figure 4: Airports Participating in or Recently Approved for Participation in the Screening Partnership Program (SPP)

Figure 4: Airports Participating...

 
Figure 7: Reasons Partial Disability Beneficiaries Stopped Receiving FECA Benefits (2005- 2011)

Figure 7: Reasons Partial...

 
Figure 4: New Partial Disability Beneficiaries (2000-2011)

Figure 4: New Partial Disability...

 
Figure 1: Number of and Reasons for Corrective Action Plans (CAP) Required by Selected States, January 1, 2010–June 30, 2012

Figure 1: Number of and Reasons...

 
Figure 1: Notional Example of Identity Theft-Based Refund Fraud

Figure 1: Notional Example of...

 
Figure 1: Visual Representation of Themes in a GIS

Figure 1: Visual Representation...

 
Figure 5: Locations of NDF Projects both Before and After Fiscal Year 2007

Figure 5: Locations of NDF...

 
Figure 4: NDF Funding by Project Category, Fiscal Years 2007 through 2012

Figure 4: NDF Funding by Project...

 
Figure 2: Electricity Generation from Coal, 1960-2010

Figure 2: Electricity Generation...

 
Total Federal Debt Outstanding, September 30, 1997, through September 30, 2012

Total Federal Debt Outstanding,...

 
Figure 6: Potential Savings under Alternative Scenario for Self-Referring Providers, 2010

Figure 6: Potential Savings...

 
Figure 3: Countries Approved to Export Specific Products by USDA’s FSIS and the European Union

Figure 3: Countries Approved to...

 
Figure 3: Examples of Homeland Security Missions Conducted by Selected CAP Wings from Fiscal Years 2007 through 2012

Figure 3: Examples of Homeland...

 
Figure 4: Funding for DOD Aerostat and Airship Efforts for Fiscal Years 2007 through 2012

Figure 4: Funding for DOD...

 
Figure 4: GAO Analysis of HUD Processes for Updating the HUD Code

Figure 4: GAO Analysis of HUD...

 
Figure 1: Key Partners Involved in Port Critical Infrastructure Operations and Oversight

Figure 1: Key Partners Involved...

 
Figure 2: Price Indexes for Brand-Name Drugs Used by Medicare Part D Beneficiaries in the Coverage Gap and by Those Who Did Not Reach the Gap in 2011

Figure 2: Price Indexes for...

 
Figure 1: Comparison of a Non-LIS Beneficiary’s Out-of-Pocket Spending for Prescription Drugs in the Coverage Gap under the Standard Benefit in 2011, without and with the Medicare Coverage Gap Discount Program in Place

Figure 1: Comparison of a...

 
Figure 5: Fiscal Years 2007 through 2016 Funding for Aerostats and Airships under Development

Figure 5: Fiscal Years 2007...

 
Figure 3: Percent of Worldwide H-2A Visa Applications Processed by Posts in Mexico, Fiscal Year 2011

Figure 3: Percent of Worldwide...

 
Figure 2: H-2A Application Processing Times, Fiscal Year 2011

Figure 2: H-2A Application...

 
Figure 1: Deadlines for Applying for Workers under the H-2A Program

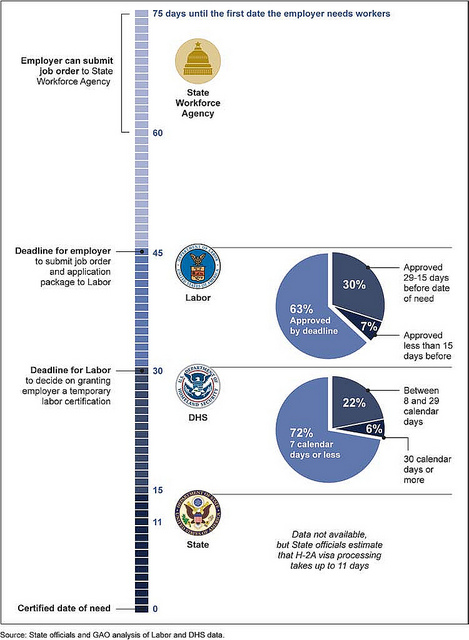
Figure 1: Deadlines for Applying...

 
Figure 1: The Amount of Recovery Act Funds Provided for Cleanup Projects at 17 Sites

Figure 1: The Amount of Recovery...

 
Figure 2: Services’ Flame Resistant Uniforms, Dates of Initiation, and Development Costs

Figure 2: Services’ Flame...

 
Figure 1: Services’ Camouflage Uniforms, Dates of Initiation and Fielding, and Development Costs

Figure 1: Services’ Camouflage...

 
Figure 1: Tax Debt Inventory in Ranges of Total Debt Owed by an Individual, as of the End of Fiscal Year 2011

Figure 1: Tax Debt Inventory in...

 
Figure 2: Methods Used to Collect Location Information

Figure 2: Methods Used to...

 
Figure 2: Locations of Unconventional Reservoirs in the United States

Figure 2: Locations of...

 
Figure 1: Conventional and Unconventional Oil and Gas Reservoirs

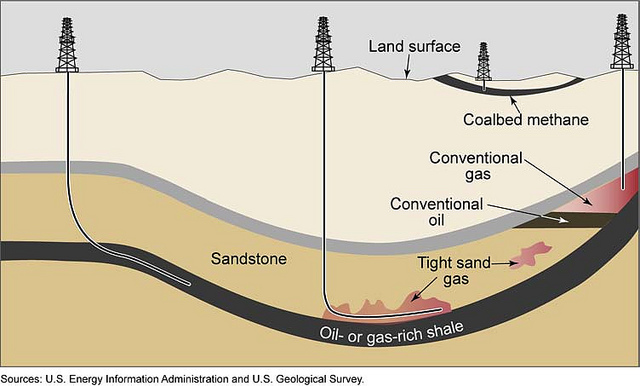
Figure 1: Conventional and...

 
Figure 10: Shale Gas Production, by Shale Play (from 2007 through 2011)

Figure 10: Shale Gas Production,...

 
Figure 8: Shale Oil Production, by Shale Play (from 2007 through 2011)

Figure 8: Shale Oil Production,...

 
Figure 4: Shale Plays and Basins in the Contiguous 48 States

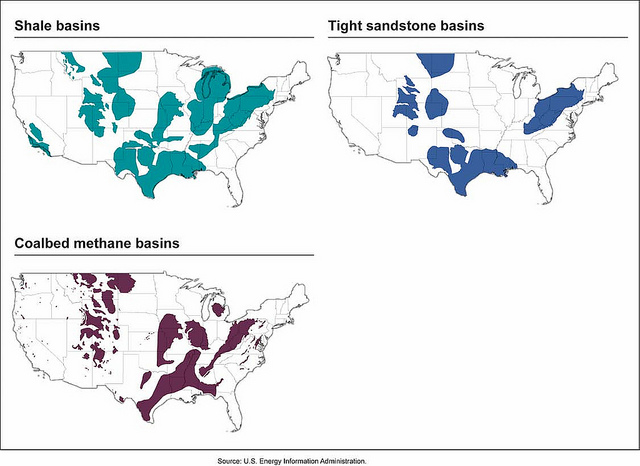
Figure 4: Shale Plays and Basins...

 
Figure 1: History of Horizontal Drilling and Hydraulic Fracturing

Figure 1: History of Horizontal...

 
Figure 2: Tax Debt Inventory in Ranges of Total Debt Owed by a Business, as of the End of Fiscal Year 2011

Figure 2: Tax Debt Inventory in...

 
Figure 1: Summary of Selected Indicators by State Groups

Figure 1: Summary of Selected...

 
Figure 6: Spent Fuel in Dry Storage

Figure 6: Spent Fuel in Dry Storage

 
Figure 5: Canister in a Transfer Cask in a Spent Nuclear Fuel Pool

Figure 5: Canister in a Transfer...

 
Figure 4: Spent Nuclear Fuel Pool

Figure 4: Spent Nuclear Fuel Pool

 
Figure 1: Commercial Spent Nuclear Fuel Storage Sites

Figure 1: Commercial Spent...

 
Figure 1: Steps of the IDES Process and Timeliness Goals

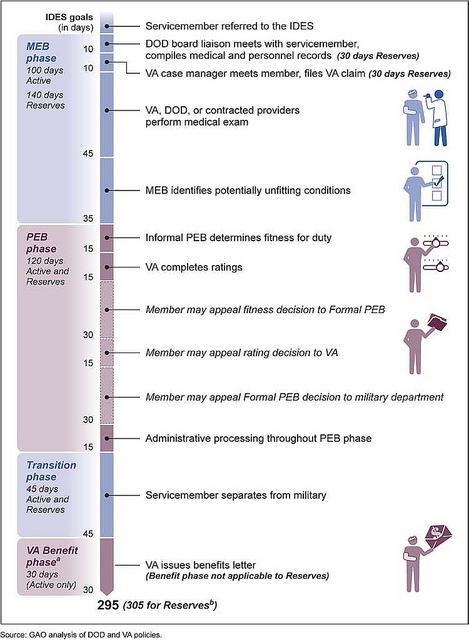
Figure 1: Steps of the IDES...

 
Figure 1: Housing Activities and Programs, by Purpose and Agency, Fiscal Year 2010

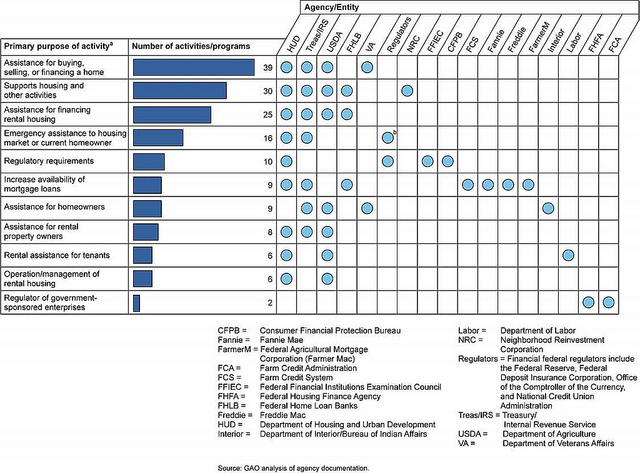
Figure 1: Housing Activities and...

 
Figure 1: Most Title 42, Sections 209(f) and (g) Employees Served at NIH, FDA, or CDC, 2010

Figure 1: Most Title 42,...

 
Figure 4: Irradiator and Bank of Unsecured Windows Looking Out onto Loading Dock

Figure 4: Irradiator and Bank of...

 
Figure 3: Combination to Lock on Door Frame Outside Blood Bank

Figure 3: Combination to Lock on...

 
Figure 2: Nonstop Beyond-Perimeter Slot Exemption Destinations from Reagan National from 2000 through 2012

Figure 2: Nonstop...

 
Figure 3: Examples of Decrease in Size of Areas Exposed to Significant Airport Noise (DNL 65 dB)

Figure 3: Examples of Decrease...

 
Figure 1: Selected Tools Available to Address Airport Noise

Figure 1: Selected Tools...

 
Figure 3: Top 10 Countries for Referrals to Fraud Prevention Units, Fiscal Year 2010

Figure 3: Top 10 Countries for...

 
Figure 1: Nonimmigrant and Immigrant Visas Issued Worldwide, Fiscal Years 1992 to 2011

Figure 1: Nonimmigrant and...

 
Figure 6: Comparison of Actual Public Assistance Per Capita Indicator with the Indicators if They Had Been Adjusted for Increases in Personal Income and Inflation, 1986 through 2011

Figure 6: Comparison of Actual...

 
Figure 1: Number of Disaster Declarations during Fiscal Years 1953 through 2011

Figure 1: Number of Disaster...

 
Figure 2: DHS R&D Obligations, Fiscal Year 2011

Figure 2: DHS R&D...

 
Figure 3: Examples of BOP’s Use of Temporary Bed Space

Figure 3: Examples of BOP’s Use...

 
Figure 5: Examples of Variation in Levels of Services Available at DOD Schools Overseas

Figure 5: Examples of Variation...

 
Figure 3: Map of Countries That Acquired UAVs by December 2011

Figure 3: Map of Countries That...

 
Figure 3: Trustee’s Disposition of Claims Filed in Madoff Liquidation, as of April 2012

Figure 3: Trustee’s Disposition...

 
Figure 3: Number of Backlogged FOIA Requests by Agency Component, 2009-2011 (in thousands)

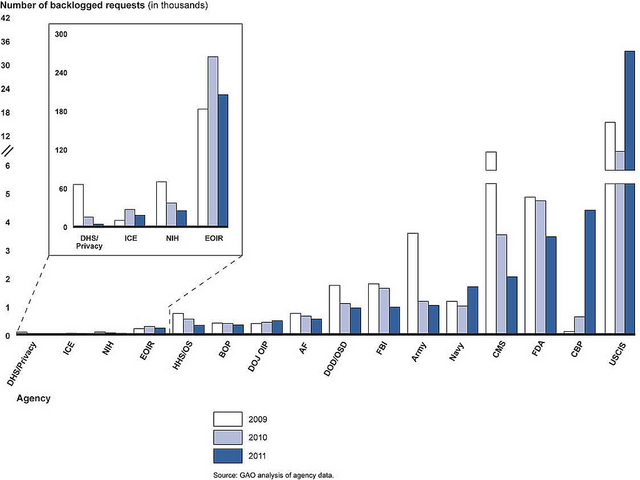
Figure 3: Number of Backlogged...

 
Figure 2: LIHEAP Funding History

Figure 2: LIHEAP Funding History

 
Figure 2: Percent of Shipments Meeting Time-Definite Delivery Standards

Figure 2: Percent of Shipments...

 
Figure 1: Four Segments of DOD’s Materiel Distribution System

Figure 1: Four Segments of DOD’s...

 
Figure 2: Risk of Identity Theft with Medicare Card under CMS’s Three Proposed Options

Figure 2: Risk of Identity Theft...

 
Figure 5: Factors That Officials Reported Led to a Change in Overall Agency Fleet Size

Figure 5: Factors That Officials...

 
Figure 4: Change in Fleets of Federal Agencies with More Than 1,000 Vehicles, Fiscal Year 2011

Figure 4: Change in Fleets of...

 
Figure 10: Comparison of the Projected End of Service Lives for the MEC Fleet with the Planned OPC Delivery Dates, as of May 2012

Figure 10: Comparison of the...

 
Figure 8: Summary of the Legacy Vessels’ Operational Hour Performance Compared with Targets, Fiscal Years 2005 through 2011

Figure 8: Summary of the Legacy...

 
Figure 3: Timeline of WHO Consultations with Internal and External Stakeholders, 2011-2012

Figure 3: Timeline of WHO...

 
Figure 1: WHO Regions, Budgets, and Staffing Levels

Figure 1: WHO Regions, Budgets,...

 
Figure 1: The Secure Communities Process

Figure 1: The Secure Communities...

 
Figure 2: Students Move from Services Provided through Their High Schools to Services Delivered through Multiple Programs

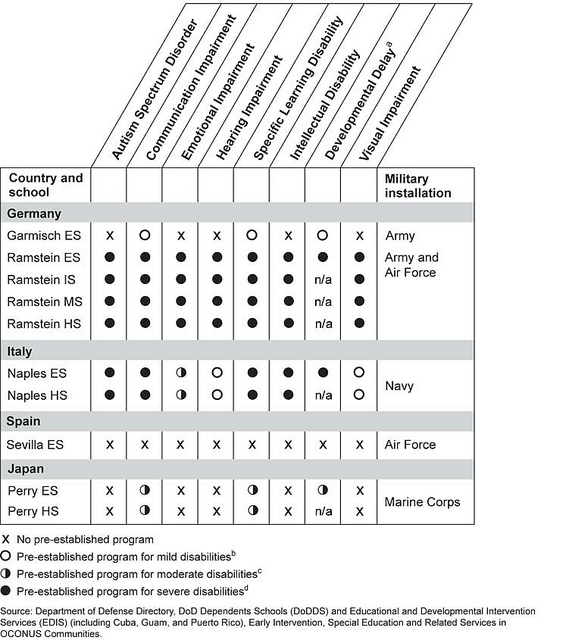
Figure 2: Students Move from...

 
Figure 1: The Electromagnetic Spectrum

Figure 1: The Electromagnetic...

 
Figure 1: Microsimulation Model Predictions of Near-Term Changes in Employer-Sponsored Coverage as a Result of PPACA

Figure 1: Microsimulation Model...