The Tour
Sign Up
Explore
Recent Photos
The Commons
Getty Collection
Galleries
World Map
App Garden
Camera Finder
Flickr Blog
Upload
Sign In
U.S. GAO's photostream
Pro User
Photostream
Sets
Favorites
Galleries
Profile
More
▾
Collections
Archives
Tags
Photos of
Archives
/
Posted in
/
2012
/
June
(27 items)
View:
Large thumbnails
▾
Map
Calendar
«
May 2012
1
2
3
4
5
6
7
8
9
10
11
12
13
14
15
16
17
18
19
20
21
22
23
24
25
26
27
28
29
30
July 2012
»
Figure 4: Number of Audits and...
Figure 10: Beneficiaries’...
Figure 9: Average Length of Stay...
Figure 8: Average Length of Stay...
Figure 2: IHS’s Primary Methods...
Figure 1: Counties in the 12 IHS...
Figure 3: Changes in Procurement...
Figure 1: Various Means of...
Figure 2: Number of Commercial...
Figure 3: Transcript Excerpts of...
Figure 4: How Phosphate Mining...
Figure 1: Map of the Western...
Figure 3: Sources of Imported...
Figure 1: State’s Process for...
Figure 1: VA’s Administrative...
Figure 1: Structure of Service...
Figure 1: Timeline for Census...
Figure 3: Examples of Cleanup...
Figure 3: Percentage and Number...
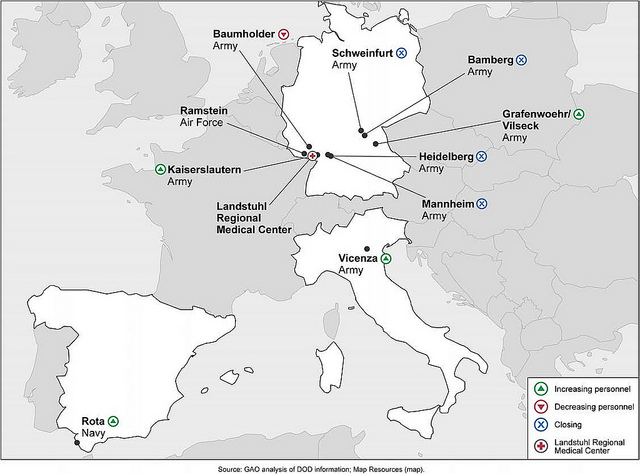
Figure 3: DOD Military...
Figure 3: Estimated Number of...
Figure 2: Estimated Unemployment...
Figure 1: Estimated U.S. Funding...
Figure 14: Geographic...
Figure 1: Sample Layout of...
Figure 5: Facility in Thailand...
Figure 4: Boxes of Chinese Wood...
Square
Small
Medium
Large
About Flickr
Who we are
Take the tour
Flickr blog
Jobs
Community
Community Guidelines
Report abuse
Help
Need help? Start here!
Help forum
FAQs
About Our Ads
Apps and the API
Flickr for mobile
App Garden
API documentation
Developer blog
Developer Guide
Follow us
Like us
Deutsch
English
Español
Français
Italiano
Português
Tiếng Việt
Bahasa Indonesia
Terms of Use
|
Your privacy
|
Yahoo! Safely
|
Copyright/IP Policy
Copyright © 2012 Yahoo! Inc. All rights reserved.