The Tour
Sign Up
Explore
Recent Photos
The Commons
Getty Collection
Galleries
World Map
App Garden
Camera Finder
Flickr Blog
Upload
Sign In
U.S. GAO's photostream
Pro User
Photostream
Sets
Favorites
Galleries
Profile
More
▾
Collections
Archives
Tags
Photos of
Archives
/
Taken in
/
2012
/
September
(24 items)
View:
Large thumbnails
▾
Map
Calendar
«
August 2012
1
2
3
4
5
6
7
8
9
10
11
12
13
14
15
16
17
18
19
20
21
22
23
24
25
26
27
28
29
30
October 2012
»
Figure 1: Most Title 42,...
Figure 1: Housing Activities and...
Figure 1: Steps of the IDES...
Figure 1: Commercial Spent...
Figure 4: Spent Nuclear Fuel Pool
Figure 5: Canister in a Transfer...
Figure 6: Spent Fuel in Dry Storage
Figure 1: Summary of Selected...
Figure 3: Trustee’s Disposition...
Figure 3: Map of Countries That...
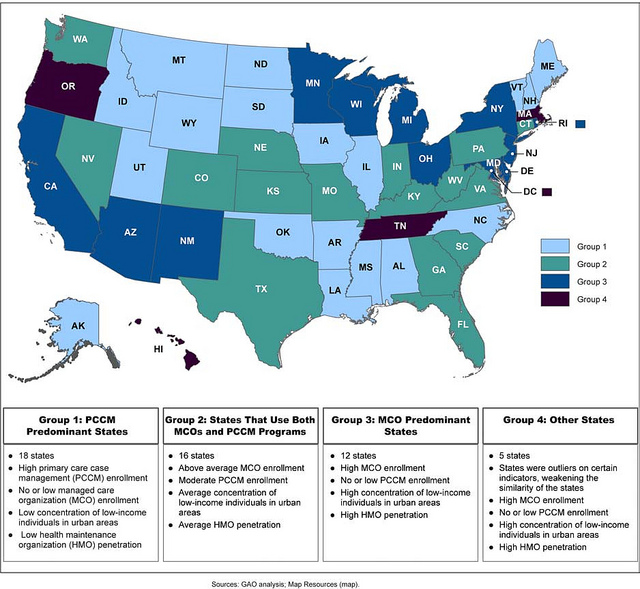
Figure 5: Examples of Variation...
Figure 3: Examples of BOP’s Use...
Figure 2: DHS R&D...
Figure 1: Number of Disaster...
Figure 6: Comparison of Actual...
Figure 1: Nonimmigrant and...
Figure 3: Top 10 Countries for...
Figure 1: Selected Tools...
Figure 3: Examples of Decrease...
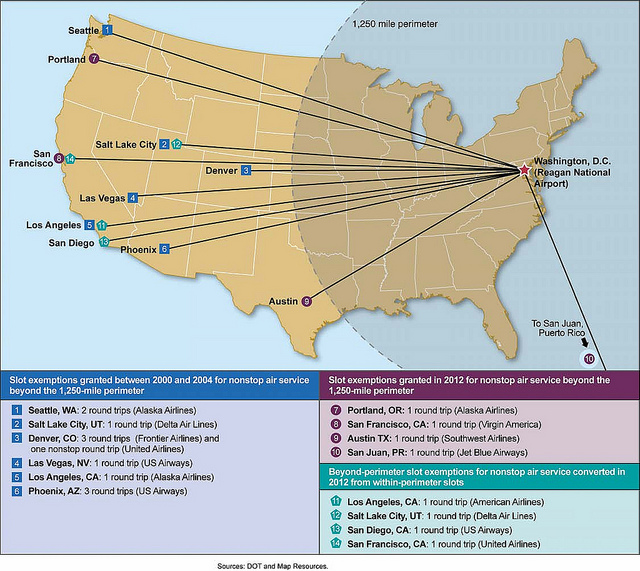
Figure 2: Nonstop...
Figure 3: Combination to Lock on...
Figure 4: Irradiator and Bank of...
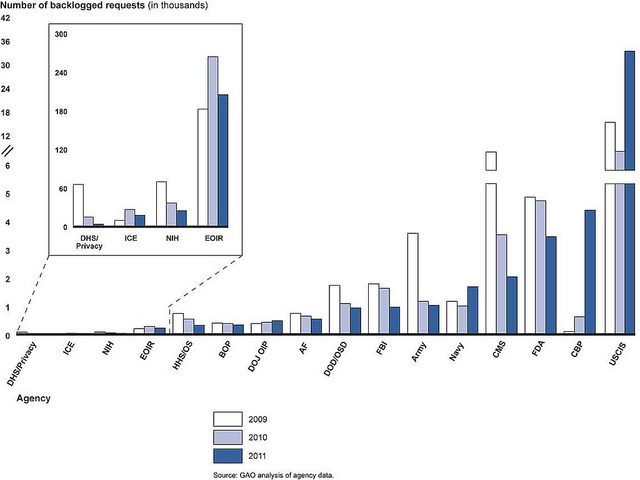
Figure 3: Number of Backlogged...
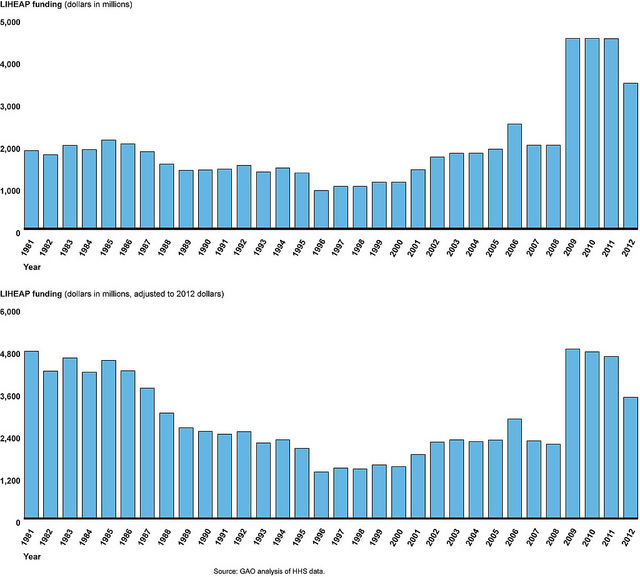
Figure 2: LIHEAP Funding History
Square
Small
Medium
Large
About Flickr
Who we are
Take the tour
Flickr blog
Jobs
Community
Community Guidelines
Report abuse
Help
Need help? Start here!
Help forum
FAQs
About Our Ads
Apps and the API
Flickr for mobile
App Garden
API documentation
Developer blog
Developer Guide
Follow us
Like us
Deutsch
English
Español
Français
Italiano
Português
Tiếng Việt
Bahasa Indonesia
Terms of Use
|
Your privacy
|
Yahoo! Safely
|
Copyright/IP Policy
Copyright © 2012 Yahoo! Inc. All rights reserved.