

Economic Newsletter
Choices Are Everywhere:Why Can’t We Just Have It All?
As the Rolling Stones song says, "You can't always get what you want." So we make choices. Every day, governments and individuals choose how much money to spend and what to purchase. The January 2013 Page One Economics...
The Output Gap: A “Potentially” Unreliable Measure of Economic Health?
The output gap is one (of many) economic indicators used by economists to measure the strength of the economy. What exactly is the output gap, and how accurately does it predict the state of the economy? Read this month's Page One Economics Newsletter, "The Output...
The Great Inflation: A Historical Overview and Lessons Learned

All inflation isn't bad—a moderate amount can signal a healthy economy. But high inflation, such as that during the Great Inflation, can lead to a viscious cycle where expectations of higher inflation lead to further increases in the price level. Read the October 2012 Page One Economics...
Glossary
Definition of the Week
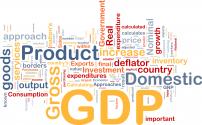
Potential Output:
The level of full gross domestic product that the economy would produce if all prices, including nominal wages, were fully flexible.
Related Reading
Okun’s law describes one of the most famous empirical relationships in macroeconomics. Proposed by economist Arthur Okun in 1962, it basically states that if GDP grows rapidly the unemployment rate declines, if growth is very low or negative the unemployment rate rises, and if growth equals potential the unemployment rate remains unchanged.
One look at recent Congressional Budget Office data shows how much estimates of the output gap can change as time passes.
Top Economic Indicators
Featured Data Series

Data Practice Using FRED
FRED Graphing Tutorials
Contact
Send questions or comments regarding the Page One Economics website to PageOneEconomics@stls.frb.org