Archives / Taken in / 2011 / November (56 items)
View: Medium thumbnails Map Calendar
1 2 3 4 5 6 7 8 9 10 11 12 13 14 15 16 17 18 19 20 21 22 23 24 25 26 27 28 29 30
 
Figure 1: U.S. Monthly Imports from Haiti, January 2009 through August 2011

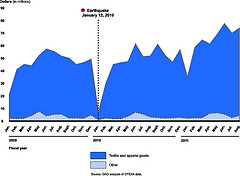
Figure 1: U.S. Monthly Imports...

 
Figure 1: Flight Profile in NextGen Environment

Figure 1: Flight Profile in...

 
Figure 4: Wildland Fires on Federal Lands for Which Agency Investigation Reports Identified Illegal Border Crossers as a Suspected Ignition Source

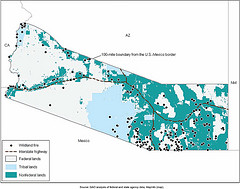
Figure 4: Wildland Fires on...

 
Figure 3: Location of Significant Human-Caused Wildland Fires in the Arizona Border Region, 2006-2010

Figure 3: Location of...

 
Figure 2: Wildland Fires in the Arizona Border Region, by Cause, 2006-2010

Figure 2: Wildland Fires in the...

 
Figure 1: Number and Dollar Amount of Adoption Tax Credit Claims, Tax Years 1998-2010

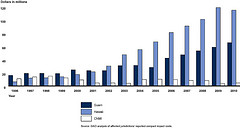
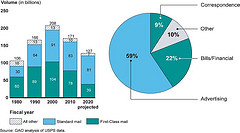
Figure 1: Number and Dollar...

 
Figure 2: Percent of Stakeholders Satisfied with TSA’s Products and Briefings by Sector

Figure 2: Percent of...

 
Figure 6: USPS Retail Revenue from Post Offices and Retail Alternatives, Fiscal Years 2006-2010

Figure 6: USPS Retail Revenue...

 
Figure 5: Typical Retail Alternatives in Urban, Suburban, and Rural

Figure 5: Typical Retail...

 
Figure 5: State’s Human Rights Vetting Process in the Gulf Countries

Figure 5: State’s Human Rights...

 
Soil Conservation Project in Bassin Zim (Central Plateau)

Soil Conservation Project in...

 
Earthquake-damaged Building at the HUEH

Earthquake-damaged Building at...

 
Neighborhood in Port-au-Prince

Neighborhood in Port-au-Prince

 
Wharf at an Existing Port in Cap-Haïtien

Wharf at an Existing Port in...

 
Figure 2: Development Corridors and Selected Sites Targeted by the U.S. Post-Earthquake Assistance

Figure 2: Development Corridors...

 
Figure 1: Timeline of Actions Taken by the Government of Haiti, International Donors, and the U.S. Government since the January 12, 2010, Earthquake

Figure 1: Timeline of Actions...

 
Figure 2: Analysis of Selected Agency Contract Obligations, Procurement-Related Suspension and Debarment Cases for Fiscal Years 2006 through 2010, and Program Characteristics

Figure 2: Analysis of Selected...

 
Figure 3: Comparison of Forward and Reverse Auction Processes

Figure 3: Comparison of Forward...

 
Figure 3: The Number and Types of Pilot Schools across the Eight FAA Regions

Figure 3: The Number and Types...

 
Figure 6: Comparison of Compact Impact Costs Reported by Affected Jurisdictions and Compact Impact Grants Awarded by Interior, 2004-2010

Figure 6: Comparison of Compact...

 
Figure 5: Reported Compact Impact Costs, 1996-2010

Figure 5: Reported Compact...

 
Figure 2: Estimated Numbers of Compact Migrants in U.S. Areas, 2005-2009

Figure 2: Estimated Numbers of...

 
Figure 1: GAO Prototype Formula for Temporary Increased FMAP Assistance to States

Figure 1: GAO Prototype Formula...

 
Figure 3: Number of States with Declining Employment-to-population Ratios (EPOP) by Month, 2007-2011

Figure 3: Number of States with...

 
Figure 2: Number of States with Declining Employment-to-population Ratios (EPOP) by Year, 1978-2011

Figure 2: Number of States with...

 
Figure 3: Preliminary Authentication Analysis Results of Part with Invalid Date Codes

Figure 3: Preliminary...

 
Figure 2: Preliminary Authentication Analysis Results of Obsolete or Rare Parts

Figure 2: Preliminary...

 
Figure 1- Total Federal Debt Outstanding (Fiscal Years Ended September 20, 2007-2011)

Figure 1- Total Federal Debt...

 
Number of FHA Loans and Single-Family Staff, 2006–2010

Number of FHA Loans and...

 
Figure 2: FHA Loan Volume and Market Share, 2006–2010

Figure 2: FHA Loan Volume and...

 
Figure 3: Examples of Zoonotic Diseases and Their Affected Populations

Figure 3: Examples of Zoonotic...

 
Figure 2: State and Local Public Health Structure

Figure 2: State and Local Public...

 
Estimated Pay Differences between Less-Educated Women and Men, 2000-2010

Estimated Pay Differences...

 
Figure 4: Percentage of Workers Who Are Low Wage, by Education Level, as of 2010

Figure 4: Percentage of Workers...

 
Figure 1: Amount of Overlap between Less-Educated and Low-Wage Worker Populations in 2010

Figure 1: Amount of Overlap...

 
Figure 4: Air Support (Unmanned Aerial System)

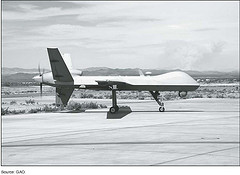
Figure 4: Air Support (Unmanned...

 
Figure 2: Mobile Video Surveillance System (MVSS)

Figure 2: Mobile Video...

 
Figure 1: Mobile Surveillance System (MSS)

Figure 1: Mobile Surveillance...

 
Figure 3: Integrated Fixed Tower Concept (SBInet Tower)

Figure 3: Integrated Fixed Tower...

 
Figure 4: Trends in Federal Reserve Bank Head Office Directors by Gender, Race and Ethnicity, and Industry, 2006-2010

Figure 4: Trends in Federal...

 
Figure 4: Overview of the U.S. Bankruptcy System

Figure 4: Overview of the U.S....

 
USPS Mail Volume and Mix

USPS Mail Volume and Mix

 
Figure 2: Boeing 787 Composition and Key Dates in Its Development and Certification

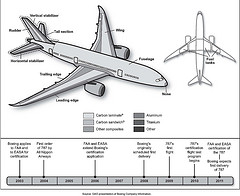
Figure 2: Boeing 787 Composition...

 
Figure 1: Debt Held by the Public under Two Fiscal Policy Simulations

Figure 1: Debt Held by the...

 
Figure 2: Oil Spill Liability Trust Fund Components

Figure 2: Oil Spill Liability...

 
Figure 7: Two-Flight Itinerary from a Remote Alaska Native Village When Victims Need Medical Forensic Services

Figure 7: Two-Flight Itinerary...

 
Figure 6: Small Ambulance Serving Remote Alaska Native Village

Figure 6: Small Ambulance...

 
Figure 4: Items Used in Traditional Healing

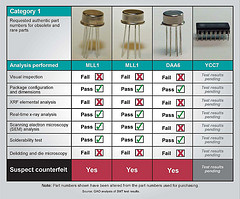
Figure 4: Items Used in...

 
Figure 1: OCS Facility in the Gulf of Mexico

Figure 1: OCS Facility in the...

 
Figure 3: Schematic of Yucca Mountain Tunnels

Figure 3: Schematic of Yucca...

 
Figure 5: Map Showing Federal Management Status of the Yucca Mountain Site

Figure 5: Map Showing Federal...

 
Figure 1: CPSC’s Electronic Process for Publishing a Report of Harm Submitted Through SaferProducts.gov

Figure 1: CPSC’s Electronic...

 
Figure 2: Cloud Computing Deployment Models

Figure 2: Cloud Computing...

 
Figure 1: Cloud Computing Service Models

Figure 1: Cloud Computing...

 
Figure 1: Average Income by Source for Households in the Lowest, Middle, and Highest of Five Income Groups, 2008

Figure 1: Average Income by...

 
Figure 3: Percentage of Adults with Incomes Below 200 Percent of the Poverty Level by Age Group, 2007-2010

Figure 3: Percentage of Adults...