This tutorial explains how to deal with exceptions and stack traces using Chrome Developer Tools.
Note: If you are a Web Developer and want to get the latest version of Developer Tools, you should use the Google Chrome release from the Developer Channel.
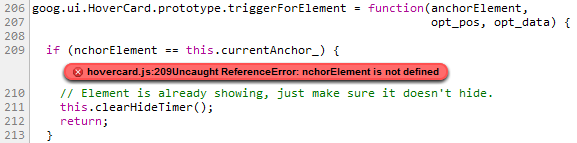
When something goes wrong, you open the DevTools console (Ctrl+Shift+J / Cmd+Option+J) and find a number of JavaScript error messages there. Each message has a link to the file name with the line number you can navigate to.
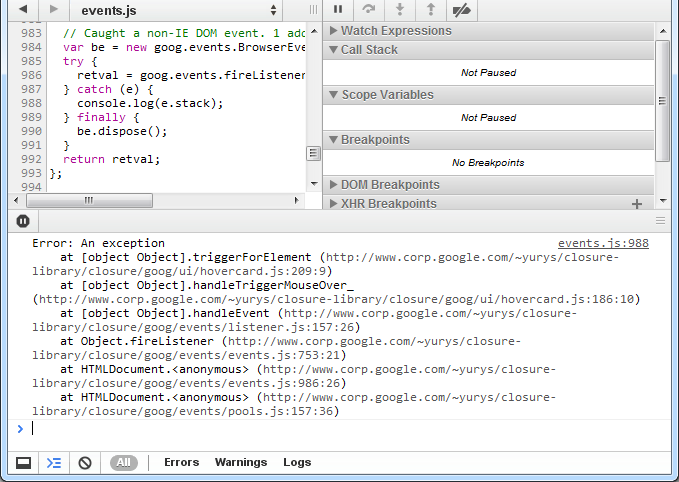
There might be several execution paths that lead to the error and it's not always obvious which one of them has happened. Once DevTools window is opened, exceptions in the console are accompanied with the complete JavaScript call stacks. You can expand these console messages to see the stack frames and navigate to the corresponding locations in the code:

You may also want to pause JavaScript execution next time exception is thrown and inspect its call stack, scope variables and state of your app. A tri-state stop button (  ) at the bottom of the Scripts panel enables you to switch between different exception handling modes: you can choose to either pause on all exception or only on the uncaught ones or you can ignore exceptions altogether.

Printing log messages to the DevTools console may be very helpful in understanding how your application behaves. You can make the log entries even more informative by including associated stack traces. There are several ways of doing that.
Each Error object has a string property named stack that contains the stack trace:
You can instrument your code with console.trace() calls that would print current JavaScript call stacks:

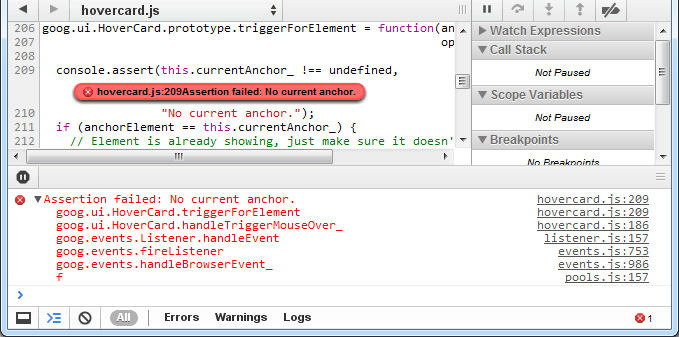
There is also a way to place assertion in your JavaScript code. Just call console.assert() with the error condition as the first parameter. Whenever this expression evaluates to false you will see a corresponding console record:
Chrome supports setting a handler function to window.onerror. Whenever a JavaScript exception is thrown in the window context and is not caught by any try/catch block, the function will be invoked with the exception's message, the URL of the file where the exception was thrown and the line number in that file passed as three arguments in that order. You may find it convenient to set an error handler that would collect information about uncaught exceptions and report it back to your server.
