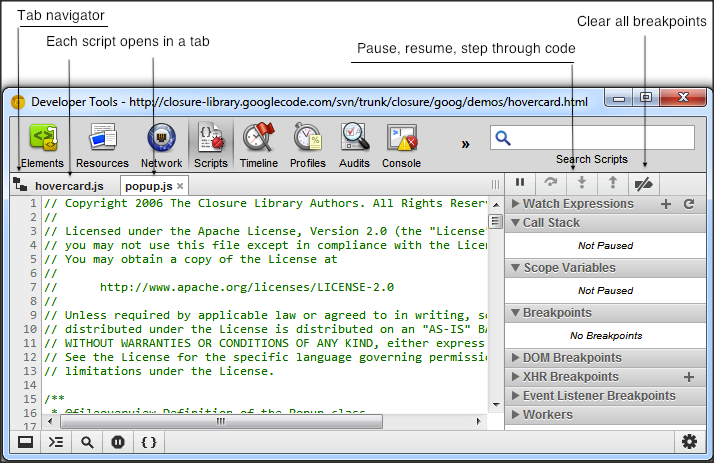
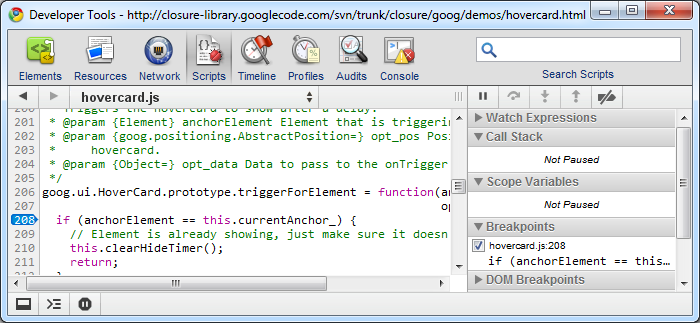
The Scripts panel lets you debug your JavaScript code.
The Scripts panel provides a graphical interface to the V8 debugger. Follow the steps below to explore the Scripts panel:
- Open Google Closure hovercard demo page.
- Open the Developer Tools window as described in the How to Access the Developer Tools section of this tutorial.
- If it is not already selected, select Scripts.

The Scripts panel lets you see all the scripts that are part
of the inspected page. Standard
controls to pause, resume, and step through code are provided below the
panel selection icons. A button to force a pause at exceptions is located
at the bottom of the window. Scripts are now (Canary) visible in separate tabs
and by pressing  the script navigator opens showing all the loaded scripts.

You can set one or more breakpoints in one or more scripts. Click the line gutter to set a breakpoint for that line of code, select another script and set another breakpoint.

Click the Pause button then move your mouse over the Google Closure hovercard demo page.

There are several keyboard shortcuts available in the Scripts panel:
- Continue: F8 or Command-/ (forward slash) on Mac or Control-/ (forward slash) on other platforms.
- Step over: F10 or Command-' (apostrophe) on Mac or Control-' (apostrophe) on other platforms.
- Step into: F11 or Command-; (semi-colon) on Mac or Control-; (semi-colon); on other platforms.
- Step out: Shift-F11 or Shift-Command-; (semi-colon) on Mac or Shift-Control-; (semi-colon) on other platforms.
- Next call frame: Control-. (period) on all platforms.
- Previous call frame: Control-, (comma) on all platforms.
