This tutorial explains how to collect and explore CPU profiles.
Note: If you are a Web Developer and want to get the latest version of Developer Tools, you should use the Google Chrome release from the Developer Channel.
Using Google Chrome, open the V8 Benchmark Suite page. Click the Start profiling button. The circle changes to red. Now return to the V8 Benchmark Suite page, and either press F5 or click the browser's Reload button to reload the page.
When the page has completed reloading, a score for the benchmark tests is shown. Return to the Developer Tools window and click the Stop profiling button. The circle changes to gray.

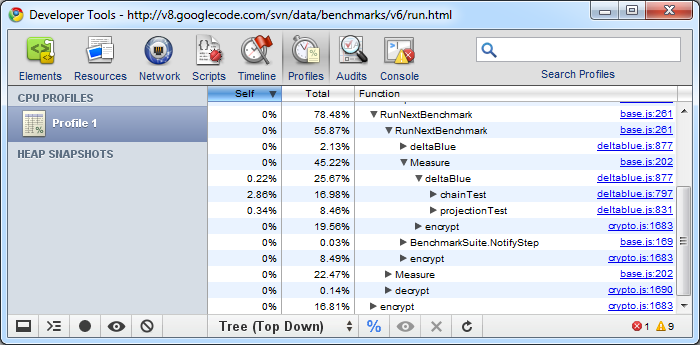
Now select the Top Down view by clicking the Bottom Up / Top Down selection button. Then click the small arrow to the left of (program) in the Function column. The Top Down view shows an overall picture of the calling structure, starting at the top of the call stack.
Note: You can click the Percentage button to view absolute times.
Select one of the functions in the Function column, then click the Focus selected function button (the Eye icon on the right).

Select one of the functions in the Function column, then click the Exclude selected function button (the X icon). Depending on the function you selected, you should see something like this:
You can record multiple profiles. Click the Start profiling button, reload the V8 Benchmark page, then click the Stop profiling button.
