Gauges

Analyze all Your Traffic in Seconds

Collect and analyze your web traffic for all your sites in real-time using our fast, reliable, hosted system. See overview data for all your sites on a single page.

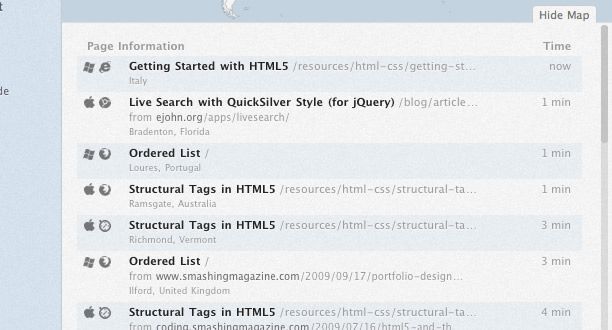
See Your Traffic As It Happens

Gauges will update your traffic data in real-time, as people visit your site. No need to refresh, or wonder what’s going on right now. You’ll know instantly.

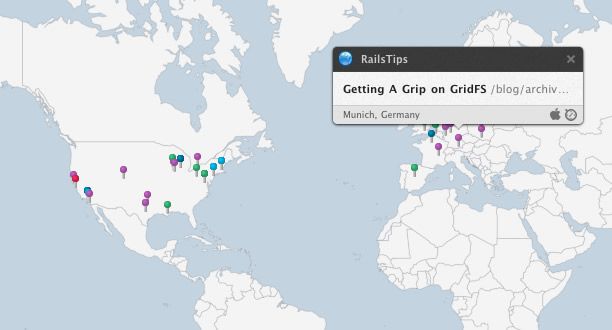
Watch your visitors with AirTraffic

See your traffic like never before! AirTraffic shows you live traffic to all your sites, on one single full-screen map dashboard, as it happens.

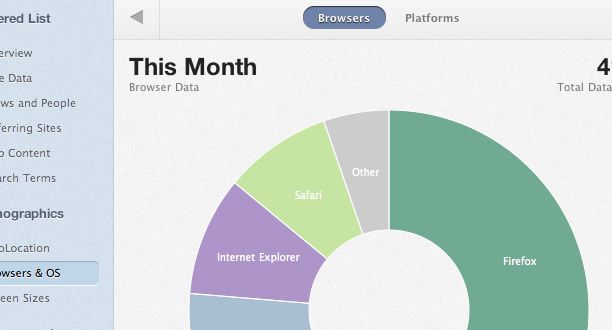
See Your Data In All Its Beauty

Gauges is fast, effective, and beautiful. You’ll love coming back often to see your traffic data presented in a breathtakingly simple, intuitive interface.

Sites List
Live Traffic
AirTraffic
A Beautiful Interface

We’ve Got a Plan For You

  • Solo

    Best for individuals with one or two sites.

    • 100,000 Page Views / Mo.
    • Unlimited Sites

    $6 per month

  • Small

    Best for small teams or individuals with clients.

    • 250,000 Page Views / Mo.
    • Unlimited Sites

    $12 per month

  • Large

    Best for large sites or large agencies with clients.

    • 1,000,000 Page Views / Mo.
    • Unlimited Sites

    $48 per month

Sign Up in Seconds

Try Gaug.es Large Plan for 7 Days Free!

Change the Way You Think About Analytics

Everything in One Place

Everything in One Place

Right at Your Fingertips

The thing we desired most when building Gaug.es was a quick, simple overview of all our sites, in one place. We were tired of remembering multiple logins, installing and updating software for each of our sites, or digging through the heap of information Google Analytics provides.

We wanted a simple, beautiful dashboard of how all our sites were doing, right now.

Real-Time Data Collection

Real-Time Data Collection

Watch Traffic as it Happens

The problem with common solutions was the delay between tracking and reporting. All of the information provided in Gaug.es is updated as each view comes in. No more waiting for reports to be compiled at a later time.

More importantly, you never even refresh the dashboard. It will continually live update as new information is tracked.

How Much? Where From? Where To?

How Much? Where From? Where To?

The Basics, Done Right

We focus on what we have found to be the most actionable metrics — how much, where from and where to.

We want to know if activity is up, down or normal. We want to know why activity has changed. And we want to know which content is performing and which is not. There’s valuable information we can provide around these three simple questions.

People are Talking; We Just Can’t Help It