


![[Home]](https://webarchive.library.unt.edu/web/20121019123042im_/http://www.stlouisfed.org/images/navigation/home.gif)
![[Banking]](https://webarchive.library.unt.edu/web/20121019123042im_/http://www.stlouisfed.org/images/navigation/banking.gif)
![[Community Development]](https://webarchive.library.unt.edu/web/20121019123042im_/http://www.stlouisfed.org/images/navigation/community_development.gif)
![[Newsroom]](https://webarchive.library.unt.edu/web/20121019123042im_/http://www.stlouisfed.org/images/navigation/newsroom.gif)
![[Education Resources]](https://webarchive.library.unt.edu/web/20121019123042im_/http://www.stlouisfed.org/images/navigation/education_resources.gif)
![[Publications]](https://webarchive.library.unt.edu/web/20121019123042im_/http://www.stlouisfed.org/images/navigation/on/publications.gif)
![[About Us]](https://webarchive.library.unt.edu/web/20121019123042im_/http://www.stlouisfed.org/images/navigation/about_us.gif)
![[Research]](https://webarchive.library.unt.edu/web/20121019123042im_/http://www.stlouisfed.org/images/navigation/research.gif)
Economic Focus
Unlike Prior Decades, House-Price Changes in Largest District Cities Are Following National Trends
Before the recent housing boom and bust, changes in local house values appeared to be a localized phenomenon. Knowing how much house prices were changing on average nationwide, or in any other city, wouldn’t help us predict local changes.
Although some areas of the country had experienced declines in the past, few people thought a nationwide decline in house prices was likely. However, all national indexes of house prices did fall significantly in recent years. And if the current trend of synchronized weakness continues, then problems in housing markets nationwide should be seen as potential problems for markets in our District.
As shown in Figure 1, during the build-up of the housing bubble, the St. Louis, Little Rock, Louisville and Memphis markets did not experience increases in prices as large as those seen in the nation as a whole.1
Figure 1
U.S. and Eighth District MSA CoreLogic House-Price Index
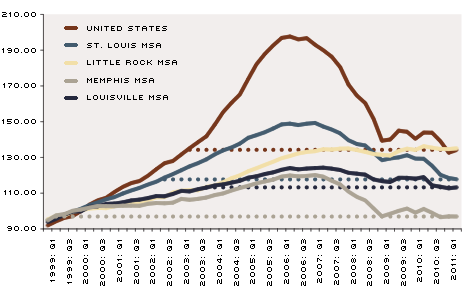
Source: CoreLogic. Figures are seasonally adjusted, quarterly and indexed, with 2000 = 100. Last observation was 2011: Q2.
NOTE: The dotted lines match 2011: Q2 house-price levels with the corresponding levels from previous years.
Nevertheless, between January 2000 and the quarter of each Eighth District MSA’s peak, prices increased about 50 percent in St. Louis, 35 percent in Little Rock, 25 percent in Louisville and 20 percent in Memphis. While the amplitude of increases over the same period for the United States on average was much higher, the pattern of growth and decline was similar.2
It might seem logical to assume that markets that experienced the highest appreciation in house prices consequently saw the largest declines. However, as seen in Figure 1, while Memphis experienced the lowest appreciation among the four metropolitan areas, home prices in Memphis are back to second quarter 1999 levels. In St. Louis, prices are down to second quarter 2002 levels, and in Louisville they are back at fourth quarter 2003 levels. Little Rock is the exception in the District; prices there have recently reached all-time highs. The better performance of Little Rock’s housing market compared with other cities in the Eighth District can be attributed to, among other factors, a lower unemployment rate and higher population growth.
Eighth District Cities and a “Poster Child”
We examined the degree to which house prices in Eighth District cities and across the U.S. vary together. To pick a city with very different economic fundamentals than those in the Eighth District, we also included Miami. As a poster child of the housing boom and bust, Miami plausibly would have experienced very different house price movements than cities in the Eighth District. Figure 2 depicts the correlation coefficients for these relationships during the previous three decades (1980 through 2011: Q2).3
Because of the important role that local indicators played prior to the 2000s, the correlation among house prices across different regions of the country was very low. During the 1980s and 1990s, the correlation among house prices in major Eighth District MSAs and Miami was quite low, ranging from -0.41 to 0.41. More recently, however, the boom and bust in house prices affected all major regions of the U.S., albeit with different magnitudes. In the 2000s, house prices in the District’s four largest metro areas moved much more closely with those in Miami. Correlations increased significantly, ranging from 0.70 to 0.81.
Figure 2
Correlation between National and MSA CoreLogic House-Price Index
Quarter-over-Quarter Change, 1980 to 2011: Q2
| U.S. | St. Louis | Memphis | Louisville | Little Rock | Miami | |
|---|---|---|---|---|---|---|
| 1980-1989 | ||||||
| U.S. | 1.00 | 0.31 | 0.18 | -0.15 | -0.12 | 0.41 |
| St. Louis | 0.31 | 1.00 | 0.13 | -0.06 | -0.03 | 0.02 |
| Memphis | 0.18 | 0.13 | 1.00 | -0.04 | -0.09 | -0.04 |
| Louisville | -0.15 | -0.06 | -0.04 | 1.00 | -0.16 | -0.41 |
| Little Rock | -0.12 | -0.03 | -0.09 | -0.16 | 1.00 | 0.24 |
| Miami | 0.41 | 0.02 | -0.04 | -0.41 | 0.24 | 1.00 |
| 1990-1999 | ||||||
| U.S. | 1.00 | 0.53 | 0.17 | 0.04 | 0.04 | 0.20 |
| St. Louis | 0.53 | 1.00 | 0.35 | 0.04 | 0.10 | -0.06 |
| Memphis | 0.17 | 0.35 | 1.00 | -0.02 | 0.42 | 0.13 |
| Louisville | 0.04 | 0.04 | -0.02 | 1.00 | 0.46 | 0.41 |
| Little Rock | 0.04 | 0.10 | 0.42 | 0.46 | 1.00 | 0.29 |
| Miami | 0.20 | -0.06 | 0.13 | 0.41 | 0.29 | 1.00 |
| 2000-2011: Q2 | ||||||
| U.S. | 1.00 | 0.86 | 0.83 | 0.67 | 0.68 | 0.85 |
| St. Louis | 0.86 | 1.00 | 0.81 | 0.76 | 0.64 | 0.81 |
| Memphis | 0.83 | 0.81 | 1.00 | 0.72 | 0.71 | 0.77 |
| Louisville | 0.67 | 0.76 | 0.72 | 1.00 | 0.68 | 0.7 |
| Little Rock | 0.68 | 0.64 | 0.71 | 0.68 | 1.00 | 0.75 |
| Miami | 0.85 | 0.81 | 0.77 | 0.70 | 0.75 | 1.00 |
SOURCE: CoreLogic
To Summarize
Loosening and then tightening credit standards affected the whole country and conceivably contributed to similar movements in prices. Although it is not clear why house-price correlations among such distinct cities are so much higher in the most recent decade, the largest Eighth District cities are following the national trend in house prices more closely than before. Therefore, even if economic fundamentals in the Eighth District suggest that our house prices are likely to stabilize, downward house-price trends in other regions of the country may continue to negatively affect prices here.
>>RELATED
A Closer Look at House Price Indexes
Endnotes
- This article uses the CoreLogic Home Price Index. [back to text]
- St. Louis peaked in 2007: Q1, Little Rock peaked in 2010: Q2, Louisville peaked in 2007: Q1 and Memphis peaked in 2007: Q2. [back to text]
- Perfect positive correlation (a correlation coefficient of +1) implies that as house prices in one area move, either up or down, prices in the other area will move in the same direction. Alternatively, perfect negative correlation means that if prices in one area move in either direction, prices in the area that is perfectly negatively correlated will move in the opposite direction. If the correlation is 0, the movements of prices in the two areas are said to have no correlation; they are completely random. [back to text]
RATE THIS ARTICLE: ![]()
![]()
![]()
![]()
![]()
