|
Download Data (XLS File) |
|
||||||||
|
||||||||
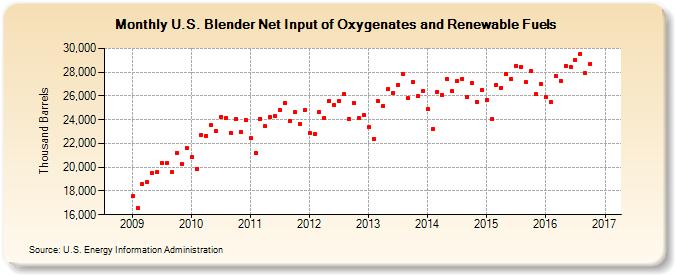
| U.S. Blender Net Input of Oxygenates and Renewable Fuels (Thousand Barrels) | ||||||||
| Year | Jan | Feb | Mar | Apr | May | Jun | Jul | Aug | Sep | Oct | Nov | Dec |
|---|---|---|---|---|---|---|---|---|---|---|---|---|
| 2009 | 17,544 | 16,606 | 18,602 | 18,720 | 19,532 | 19,574 | 20,339 | 20,376 | 19,570 | 21,234 | 20,302 | 21,648 |
| 2010 | 20,858 | 19,828 | 22,739 | 22,650 | 23,535 | 23,022 | 24,247 | 24,176 | 22,882 | 24,043 | 22,999 | 23,995 |
| 2011 | 22,447 | 21,209 | 24,061 | 23,439 | 24,230 | 24,273 | 24,849 | 25,391 | 23,896 | 24,608 | 23,633 | 24,801 |
| 2012 | 22,901 | 22,755 | 24,641 | 24,148 | 25,568 | 25,242 | 25,588 | 26,148 | 24,069 | 25,430 | 24,116 | 24,398 |
| 2013 | 23,360 | 22,410 | 25,542 | 25,152 | 26,577 | 26,285 | 26,931 | 27,821 | 25,819 | 27,158 | 25,988 | 26,428 |
| 2014 | 24,896 | 23,256 | 26,368 | 26,117 | 27,388 | 26,432 | 27,294 | 27,465 | 25,884 | 27,048 | 25,488 | 26,526 |
| 2015 | 25,637 | 24,029 | 26,957 | 26,688 | 27,825 | 27,424 | 28,544 | 28,475 | 27,133 | 28,056 | 26,123 | 27,024 |
| 2016 | 25,883 | 25,490 | 27,683 | 27,278 | 28,552 | 28,436 | 29,041 | 29,552 | 27,892 | 28,720 | ||
| - = No Data Reported; -- = Not Applicable; NA = Not Available; W = Withheld to avoid disclosure of individual company data. |
| Release Date: 12/30/2016 |
| Next Release Date: 1/31/2017 |
Referring Pages: