|
Download Data (XLS File) |
|
||||||||
|
||||||||
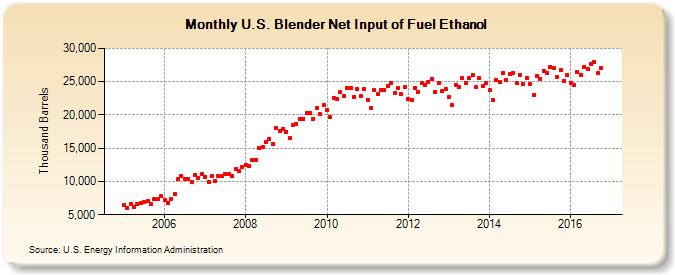
| U.S. Blender Net Input of Fuel Ethanol (Thousand Barrels) | ||||||||
| Year | Jan | Feb | Mar | Apr | May | Jun | Jul | Aug | Sep | Oct | Nov | Dec |
|---|---|---|---|---|---|---|---|---|---|---|---|---|
| 2005 | 6,432 | 6,004 | 6,675 | 6,139 | 6,539 | 6,696 | 6,970 | 7,102 | 6,537 | 7,300 | 7,323 | 7,768 |
| 2006 | 7,268 | 6,761 | 7,359 | 8,121 | 10,312 | 10,868 | 10,297 | 10,328 | 9,863 | 10,977 | 10,544 | 11,103 |
| 2007 | 10,714 | 9,963 | 10,753 | 10,086 | 10,750 | 10,793 | 11,070 | 11,168 | 10,824 | 11,872 | 11,638 | 12,179 |
| 2008 | 12,439 | 12,269 | 13,163 | 13,234 | 15,005 | 15,174 | 15,935 | 16,393 | 15,694 | 18,017 | 17,510 | 17,939 |
| 2009 | 17,469 | 16,537 | 18,526 | 18,633 | 19,404 | 19,459 | 20,214 | 20,238 | 19,418 | 21,081 | 20,167 | 21,531 |
| 2010 | 20,740 | 19,721 | 22,609 | 22,465 | 23,381 | 22,865 | 24,093 | 24,006 | 22,681 | 23,853 | 22,832 | 23,861 |
| 2011 | 22,290 | 21,055 | 23,768 | 23,108 | 23,800 | 23,780 | 24,323 | 24,826 | 23,287 | 24,029 | 23,101 | 24,140 |
| 2012 | 22,328 | 22,168 | 24,053 | 23,511 | 24,858 | 24,510 | 24,950 | 25,451 | 23,404 | 24,758 | 23,547 | 23,895 |
| 2013 | 22,748 | 21,523 | 24,562 | 24,158 | 25,527 | 24,833 | 25,517 | 26,004 | 24,141 | 25,613 | 24,340 | 24,842 |
| 2014 | 23,733 | 22,221 | 25,206 | 24,889 | 26,305 | 25,297 | 26,207 | 26,318 | 24,730 | 25,978 | 24,589 | 25,609 |
| 2015 | 24,717 | 23,038 | 25,777 | 25,420 | 26,637 | 26,233 | 27,141 | 27,112 | 25,692 | 26,735 | 25,029 | 25,959 |
| 2016 | 24,864 | 24,457 | 26,438 | 26,018 | 27,199 | 26,968 | 27,657 | 27,944 | 26,362 | 27,117 | ||
| - = No Data Reported; -- = Not Applicable; NA = Not Available; W = Withheld to avoid disclosure of individual company data. |
| Release Date: 12/30/2016 |
| Next Release Date: 1/31/2017 |
Referring Pages: