|
Download Data (XLS File) |
|
||||||||
|
||||||||
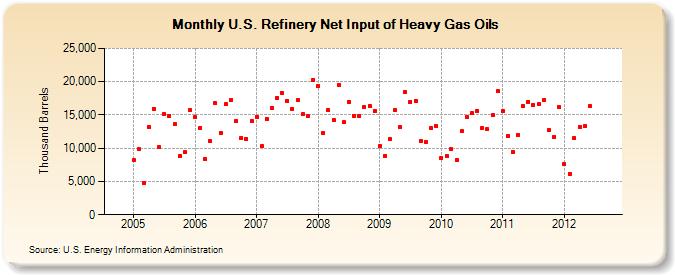
| U.S. Refinery Net Input of Heavy Gas Oils (Thousand Barrels) | ||||||||
| Year | Jan | Feb | Mar | Apr | May | Jun | Jul | Aug | Sep | Oct | Nov | Dec |
|---|---|---|---|---|---|---|---|---|---|---|---|---|
| 2005 | 8,234 | 9,848 | 4,798 | 13,151 | 15,952 | 10,132 | 15,118 | 14,897 | 13,573 | 8,800 | 9,370 | 15,773 |
| 2006 | 14,619 | 13,051 | 8,337 | 11,045 | 16,744 | 12,327 | 16,601 | 17,271 | 14,111 | 11,538 | 11,417 | 14,152 |
| 2007 | 14,725 | 10,256 | 14,420 | 16,049 | 17,569 | 18,328 | 17,128 | 15,930 | 17,303 | 15,086 | 14,816 | 20,306 |
| 2008 | 19,358 | 12,254 | 15,716 | 14,283 | 19,529 | 13,907 | 16,924 | 14,900 | 14,807 | 16,191 | 16,373 | 15,652 |
| 2009 | 10,387 | 8,891 | 11,345 | 15,682 | 13,125 | 18,441 | 17,001 | 17,110 | 11,069 | 10,970 | 13,015 | 13,294 |
| 2010 | 8,537 | 8,840 | 9,871 | 8,285 | 12,516 | 14,634 | 15,247 | 15,662 | 13,013 | 12,868 | 15,023 | 18,521 |
| 2011 | 15,569 | 11,891 | 9,459 | 12,038 | 16,382 | 17,016 | 16,548 | 16,589 | 17,279 | 12,666 | 11,727 | 16,166 |
| 2012 | 7,548 | 6,190 | 11,529 | 13,250 | 13,266 | 16,333 | ||||||
| - = No Data Reported; -- = Not Applicable; NA = Not Available; W = Withheld to avoid disclosure of individual company data. |
| Release Date: 8/30/2012 |
| Next Release Date: Last Week of September 2012 |