|
Download Data (XLS File) |
|
||||||||
|
||||||||
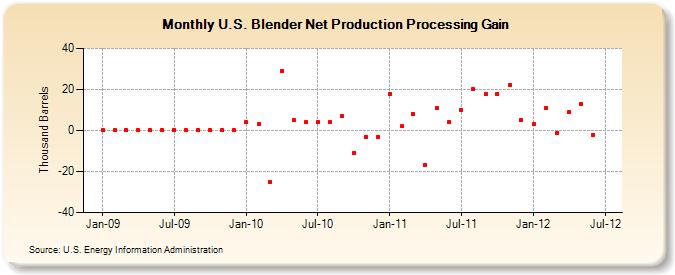
| U.S. Blender Net Production Processing Gain (Thousand Barrels) | ||||||||
| Year | Jan | Feb | Mar | Apr | May | Jun | Jul | Aug | Sep | Oct | Nov | Dec |
|---|---|---|---|---|---|---|---|---|---|---|---|---|
| 2009 | 0 | 0 | 0 | 0 | 0 | 0 | 0 | 0 | 0 | 0 | 0 | 0 |
| 2010 | 4 | 3 | -25 | 29 | 5 | 4 | 4 | 4 | 7 | -11 | -3 | -3 |
| 2011 | 18 | 2 | 8 | -17 | 11 | 4 | 10 | 20 | 18 | 18 | 22 | 5 |
| 2012 | 3 | 11 | -1 | 9 | 13 | -2 | ||||||
| - = No Data Reported; -- = Not Applicable; NA = Not Available; W = Withheld to avoid disclosure of individual company data. |
| Release Date: 8/30/2012 |
| Next Release Date: Last Week of September 2012 |